Ian Landsman
September 19, 2016 / Release Notes / 611 Words
HelpSpot 4.5 has introduced a new report format that provides even more ways to visualize your help desk data. The comparison matrix report is a super flexible, super powerful report. To summarize, you get two axis of data compared in a heat mapped matrix. What does this mean in real life? The matrix report will allow you to quick spot trends and analyze segmented help desk data ways that were not previously possible. Let’s walk through some examples of what makes this report so great.
First to get to the matrix report tool, simply navigate to “Reports” and then select “Comparison Matrix”. 
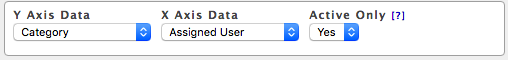
Let’s start by building a report that will allow us to visualize what categories each of staff members are working in. We will find a “x-axis” and “y-axis” drop down box that we will use to select the Category and Assigned User.
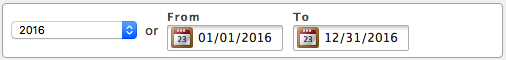
Like other reports in HelpSpot we can also select a time range that we wish to report on.
Now we can click on “Run Report” and see our results.
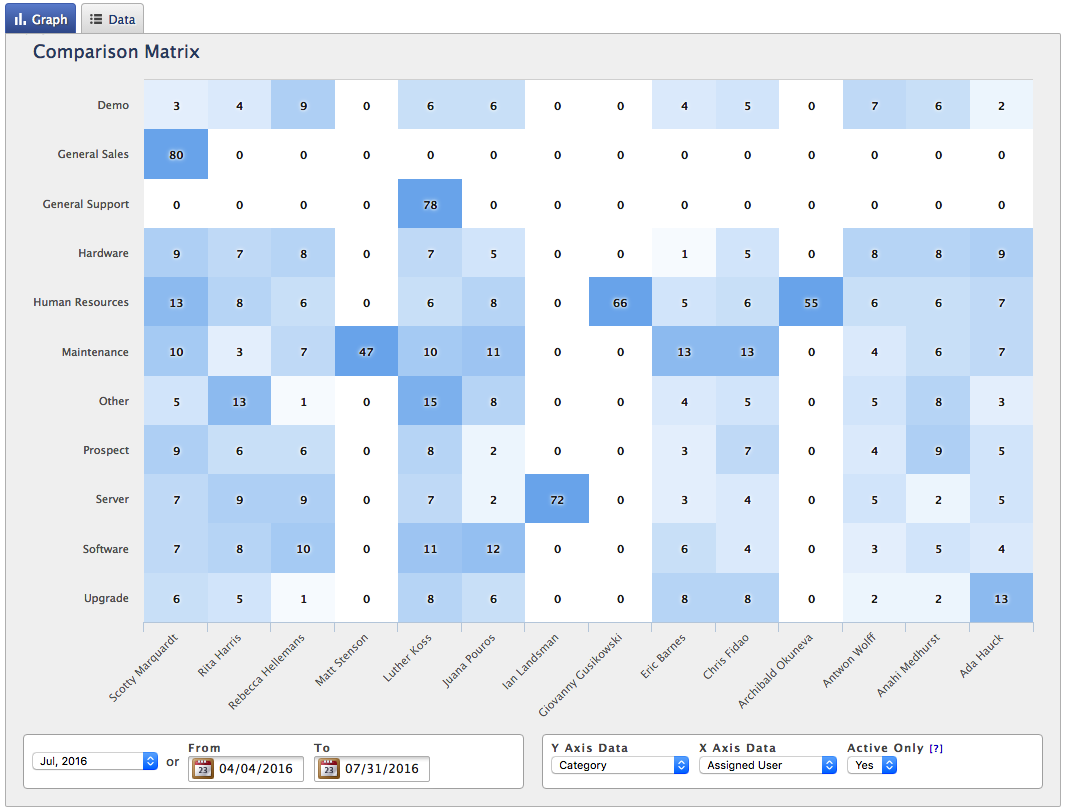
From this report we can evaluate how request are being distributed in HelpSpot. For instance all server issues are being assigned to Ian and the General Support load is falling to Luther. You can see how you can use this display to quickly evaluate a very large set of data.
We can also build time based reports in the comparison matrix. In this example I’ll set y-axis as my assigned user and my x-axis as the open day: day. I can now view the heat map of each of my agent’s load for each day included in the report.
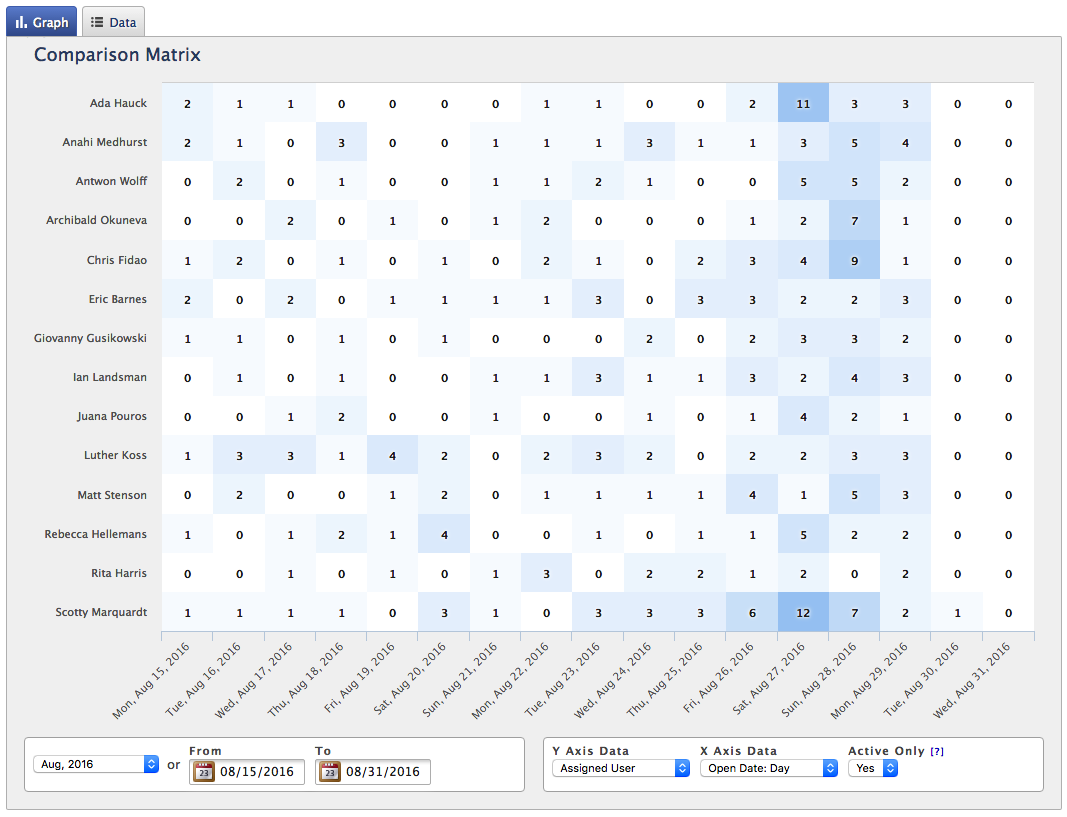 This report reveals that 27th and 28th were some of our busiest days with Scotty and Ada taking on the most requests.
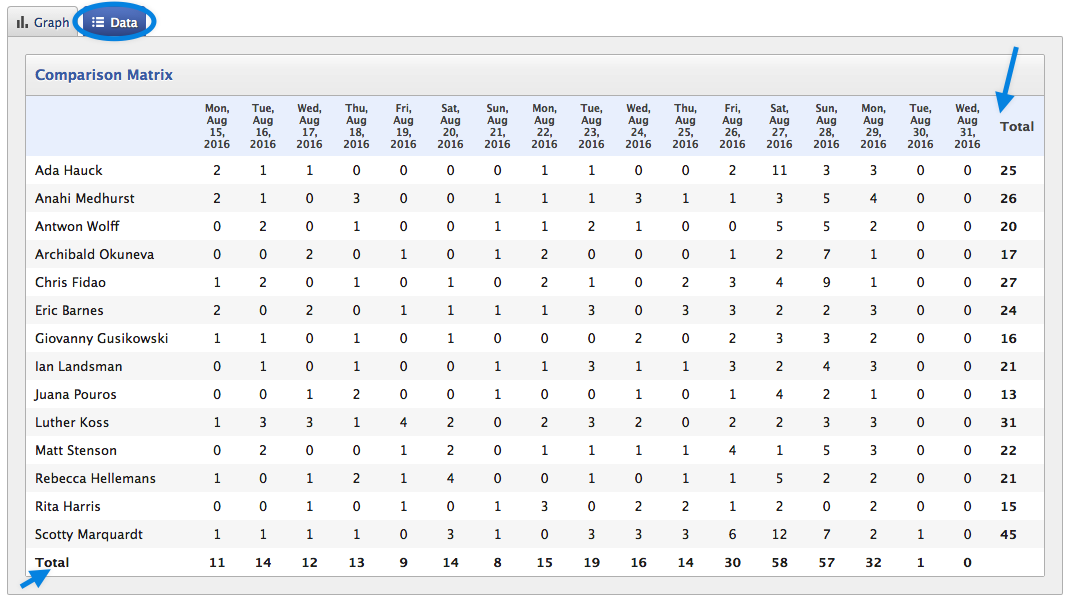
Switching to the data tab I can also see totals for each axis displayed in this view. This allows me to quickly see both my daily totals as well as each agent’s totals. I will note that all of this data is also available for export as a csv. So if you want to perform more advanced calculations than the totals you can do so in an application like Microsoft Excel or Apple Numbers.
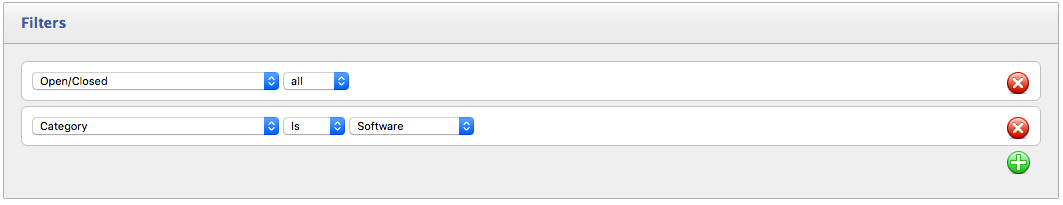
Let’s drill into this data a little more. Since I have the same filtering capabilities in the comparison matrix report as I do in other reports I can limit this report that I have built to a specific category. Let’s say we are wanting look at the agent load only for the software category. I can simply add a filter to show me only those requests.
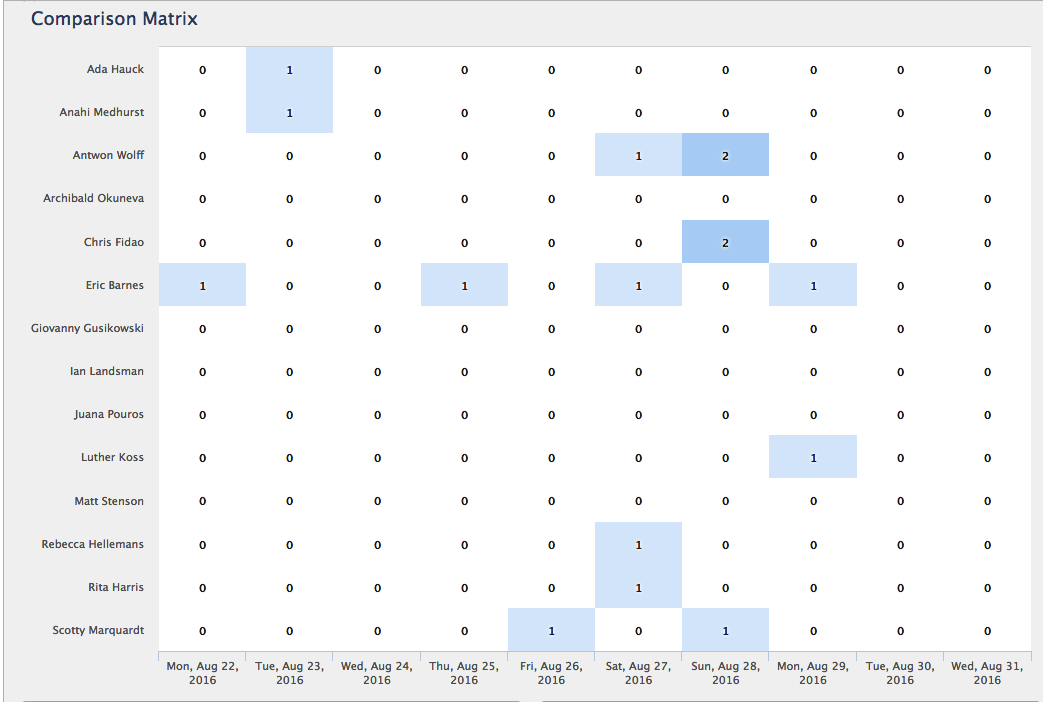
Now my report shows me that the 26th was are biggest day for software issues and Anton and Chris took the majority of those requests.
Hopefully with these few examples you can start to see all of the possibilities that the comparison matrix report affords. Combining filter and adjusting the x and y axis of the report can provide you with truly powerful datasets that can inform smarter decision making.