Ian Landsman
September 9, 2021 / Articles / 1799 Words
Customer service reporting typically involves presenting data that helps answer these questions:
To answer these questions, you’ll need a way to automatically collect data as you work. Shared email accounts such as Gmail or Outlook won’t collect much — if any — data, so you won’t be able to report on any of the questions listed above. To start collecting data, you’ll need a help desk software with built-in reporting features.
In this post, we start by sharing the most common types of customer service reports and what they’re used for. Then, we have an in-depth walk-through of customer service reporting in HelpSpot that shows you how to create, customize and use each report.
Want to try customer service reporting yourself? We offer a free 21-day trial so you can get a feel for our reporting tools and start learning more about your teams’ workloads and customer issues*. To start your free trial,* sign up here**.
Tracking important metrics over time will help you know the topics where your team needs more (or less) training, when to make new hires, and how to improve customer experience. Here are some of the most helpful reports to get you started:
Requests Over Time: Monitor your team’s workload and how often your customers are experiencing problems with particular products or services.
Interactions per Ticket: Monitor the number of emails back and forth between your team and the customer before the issue is resolved.
First Response Speed: Monitor how long your customer has to wait for an initial response from your team.
Resolution Speed: Monitor how long your customer has to wait from the time they initially reach out until full resolution.
Average Response Time: Monitor how long your customer has to wait for each response after the initial response until full resolution.
Customer Satisfaction Scores: Monitor KPIs for overall customer satisfaction and trends for what makes the customers satisfied vs. unsatisfied with your customer service.
HelpSpot’s reporting tool can be accessed by simply navigating to the reporting tab along the top. In the ‘Reports’ tab, each report is listed on the left.
The reports start with a commonly used template, but you can customize reports by choosing from various drop-down menus that cover all data points from timeframes to customized tags.
Every report is built on real-time data. In a matter of seconds, you can generate current, quantifiable reports to answer any question.
In this section, we’ll show you how to create each report listed above and show you options for customization.
‘Requests Over Time’ displays the number of emails on the y-axis, but the x-axis will depend on the grouping you choose.
For example, you can choose ‘day of week’ (to see what days are the busiest) or ‘hour of the day’ (to see what hours of the day are busiest).
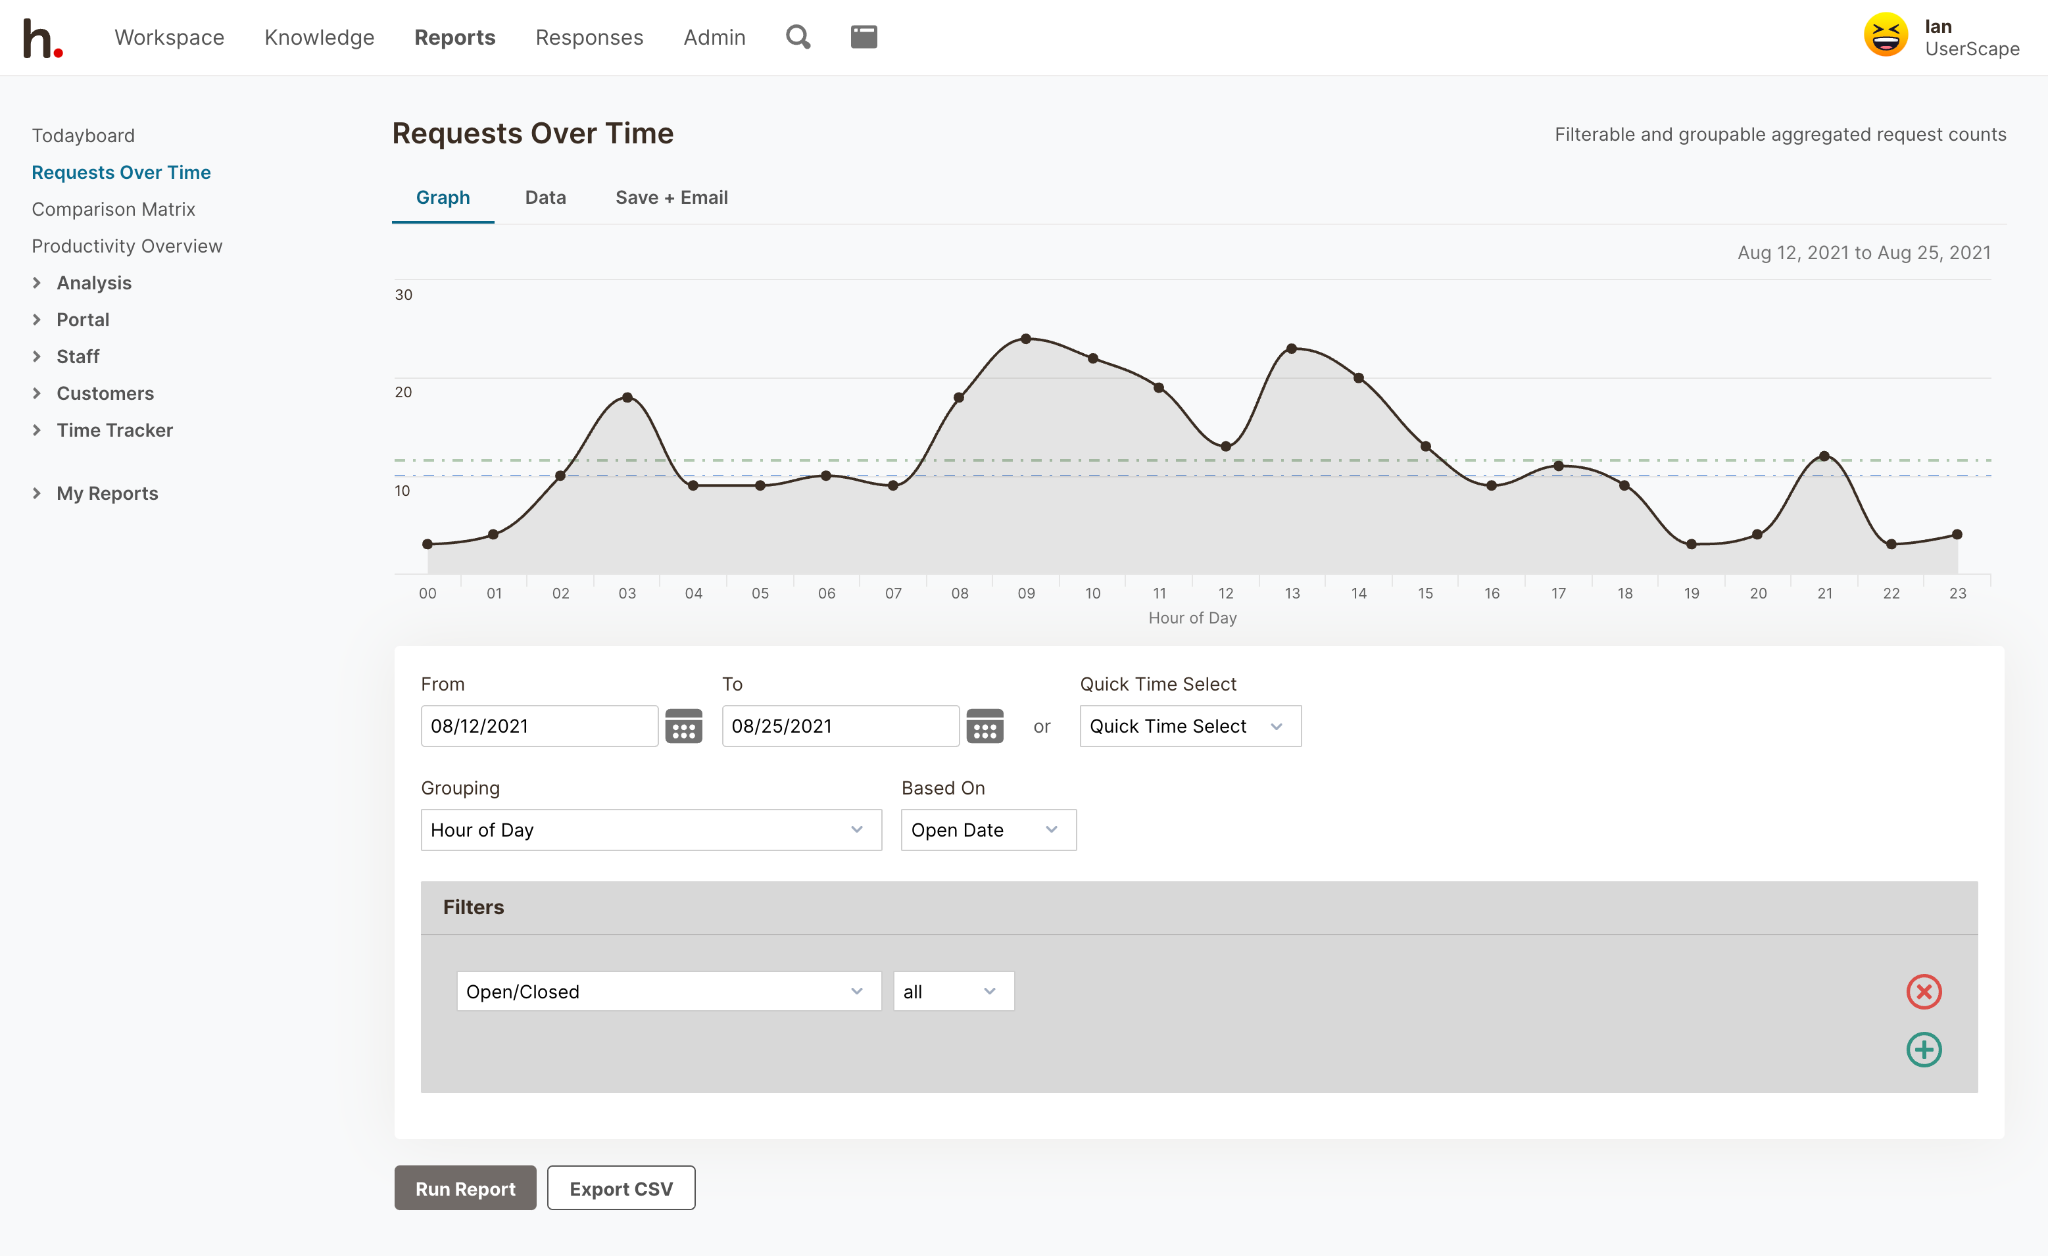 You can also choose to group by one or multiple categories and tags.
For example, if an HR department only wants to look at the requests for their department, they can filter results by the categories they are responsible for.
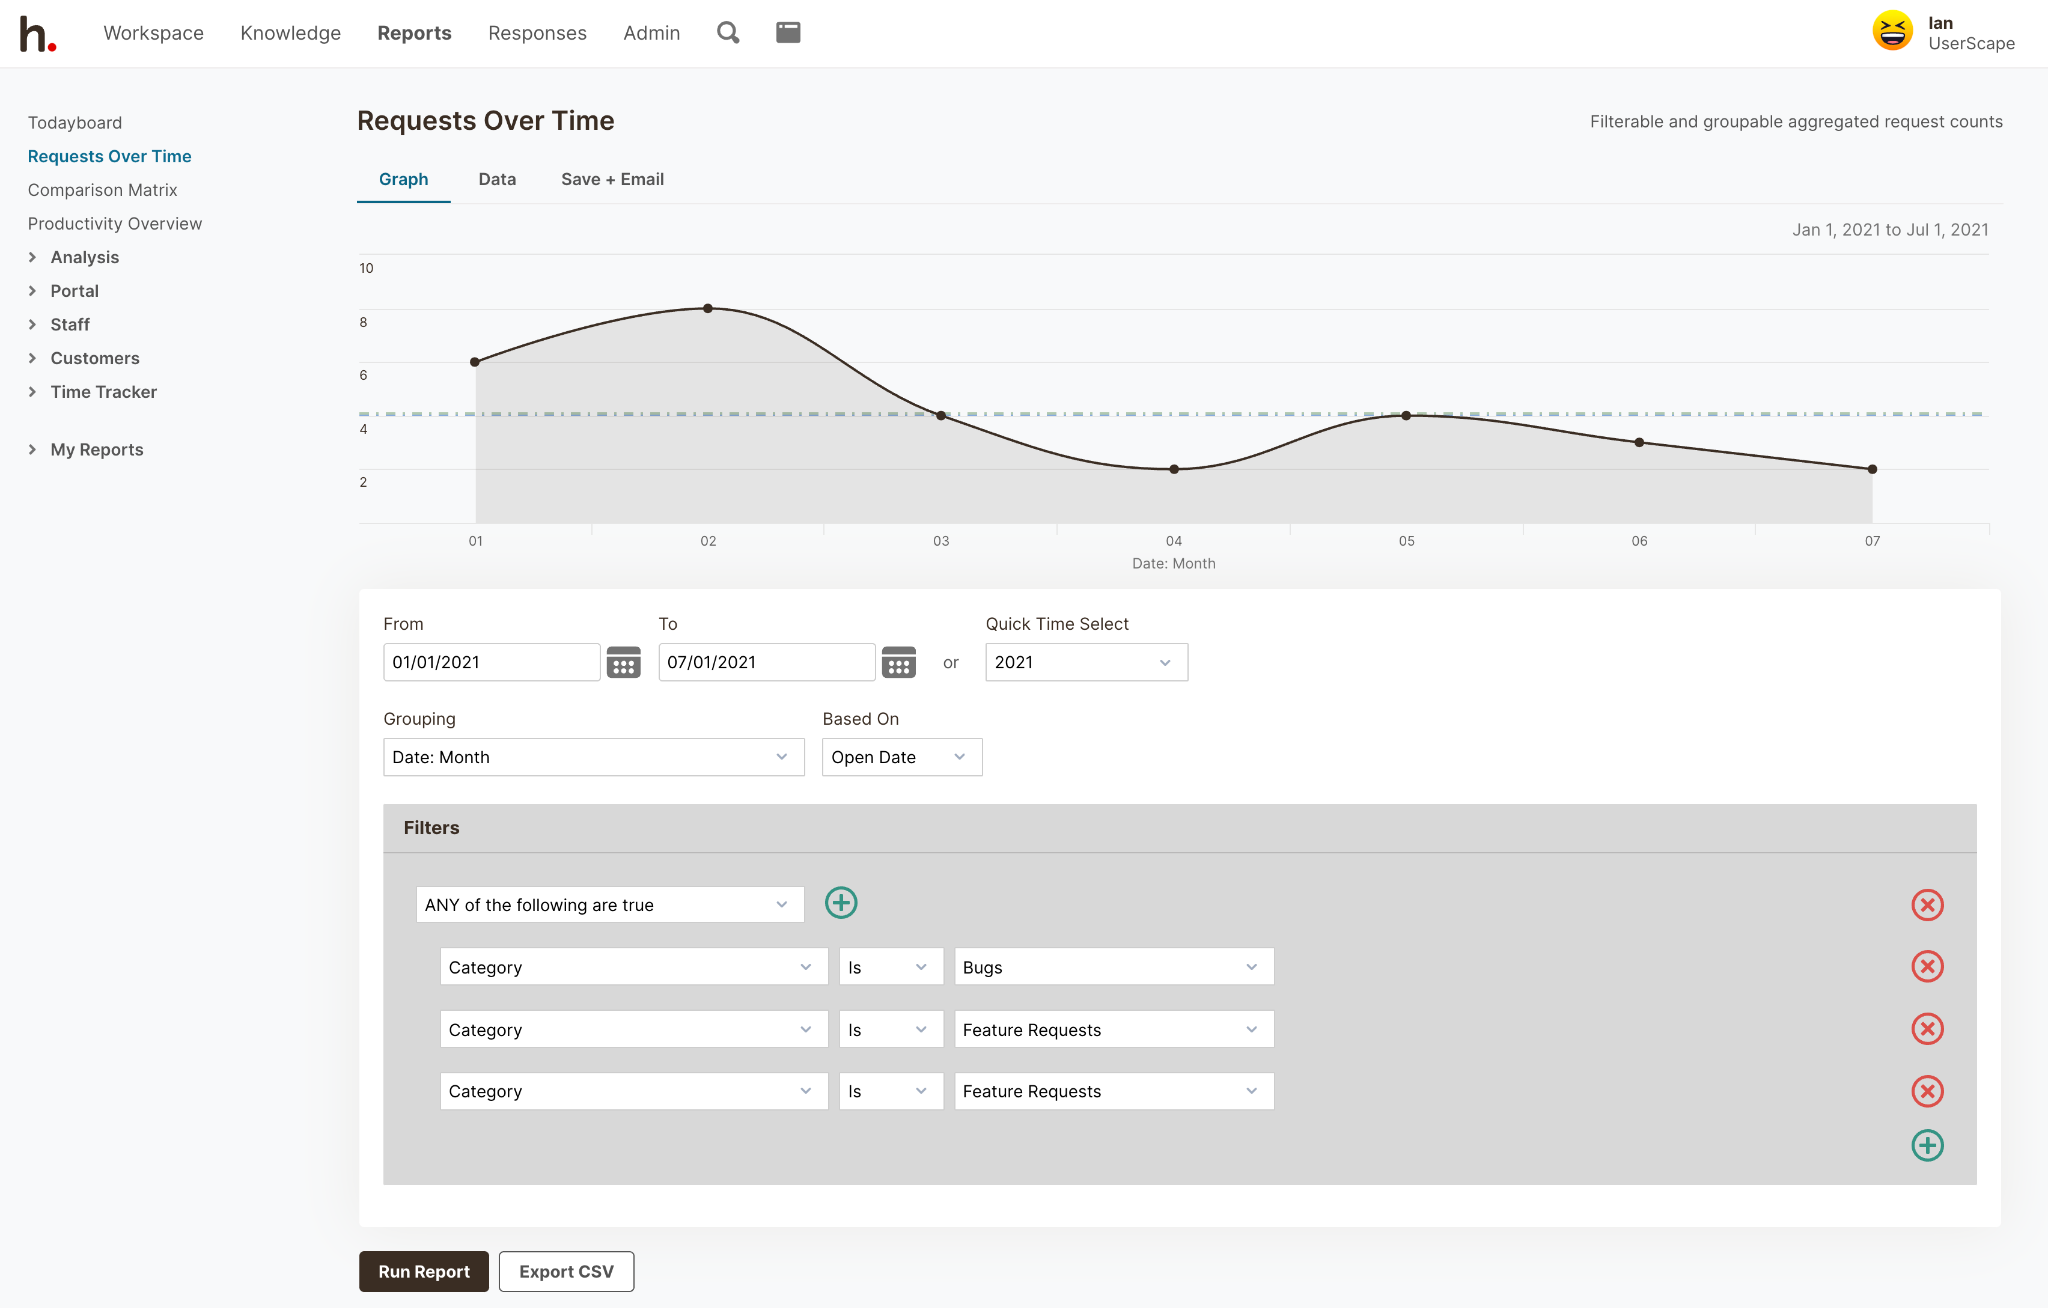 By using the ‘Requests Over Time’ report, you can know which topics your customers ask about the most often. Knowing which topics your customers are most interested in, you can create new articles for your knowledge base or self-service customer support.
You’ll also be able to evenly distribute the workload and ensure you have enough coverage at your busiest times. If you notice that most of your emails are coming in between 10 a.m.- 12 p.m., you can overlap schedules or hire a part-time employee to add extra coverage. By adding extra coverage, emails will be answered more quickly — resulting in greater customer satisfaction.
While all other reports track the number of email threads (or tickets) for certain criteria, the ‘Interactions Over Time’ report tracks individual emails and notes.
The ‘Interactions Over Time’ report separates and tracks the number of emails to customers, emails from customers, and internal notes.
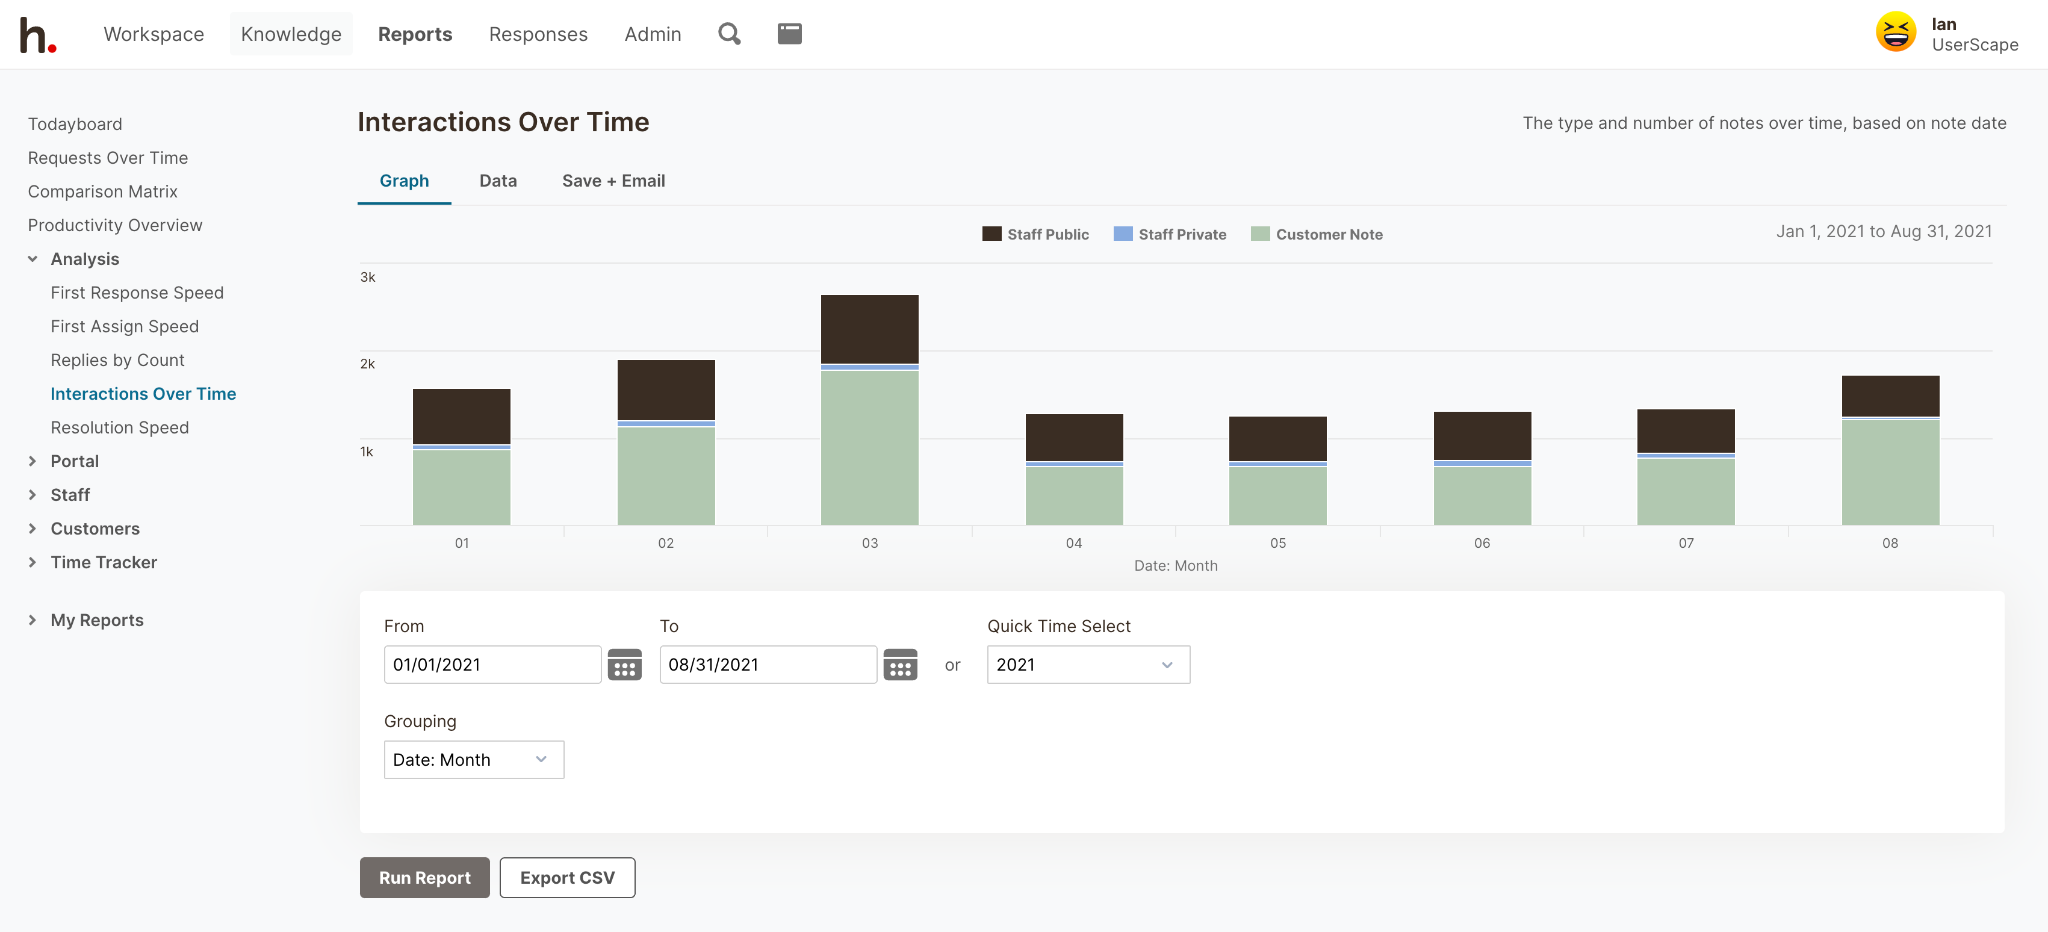 The benefit of this report is that you’ll be able to see at a glance how much activity is involved to resolve specific customer issues or customer requests, in general.
If you get complaints that it takes too long to resolve issues, you can look at the numbers and set a specific goal to cut down the number of emails it takes to resolve customers’ issues. If you notice there are a lot of internal notes around a particular topic, you’ll know that your team needs more training in this area.
When a customer asks a question that requires some time and research to answer, they still expect a prompt reply that lets them know you’re working on it. For questions that are very time-sensitive (e.g. I’m locked out of my account), they expect an immediate response that resolves the issue. Either way, a quick initial response time is important for meeting customer expectations.
With the ‘First Response Speed’ report, you can see how long it’s taking your team or individual team members to initially respond to emails over any timeframe.
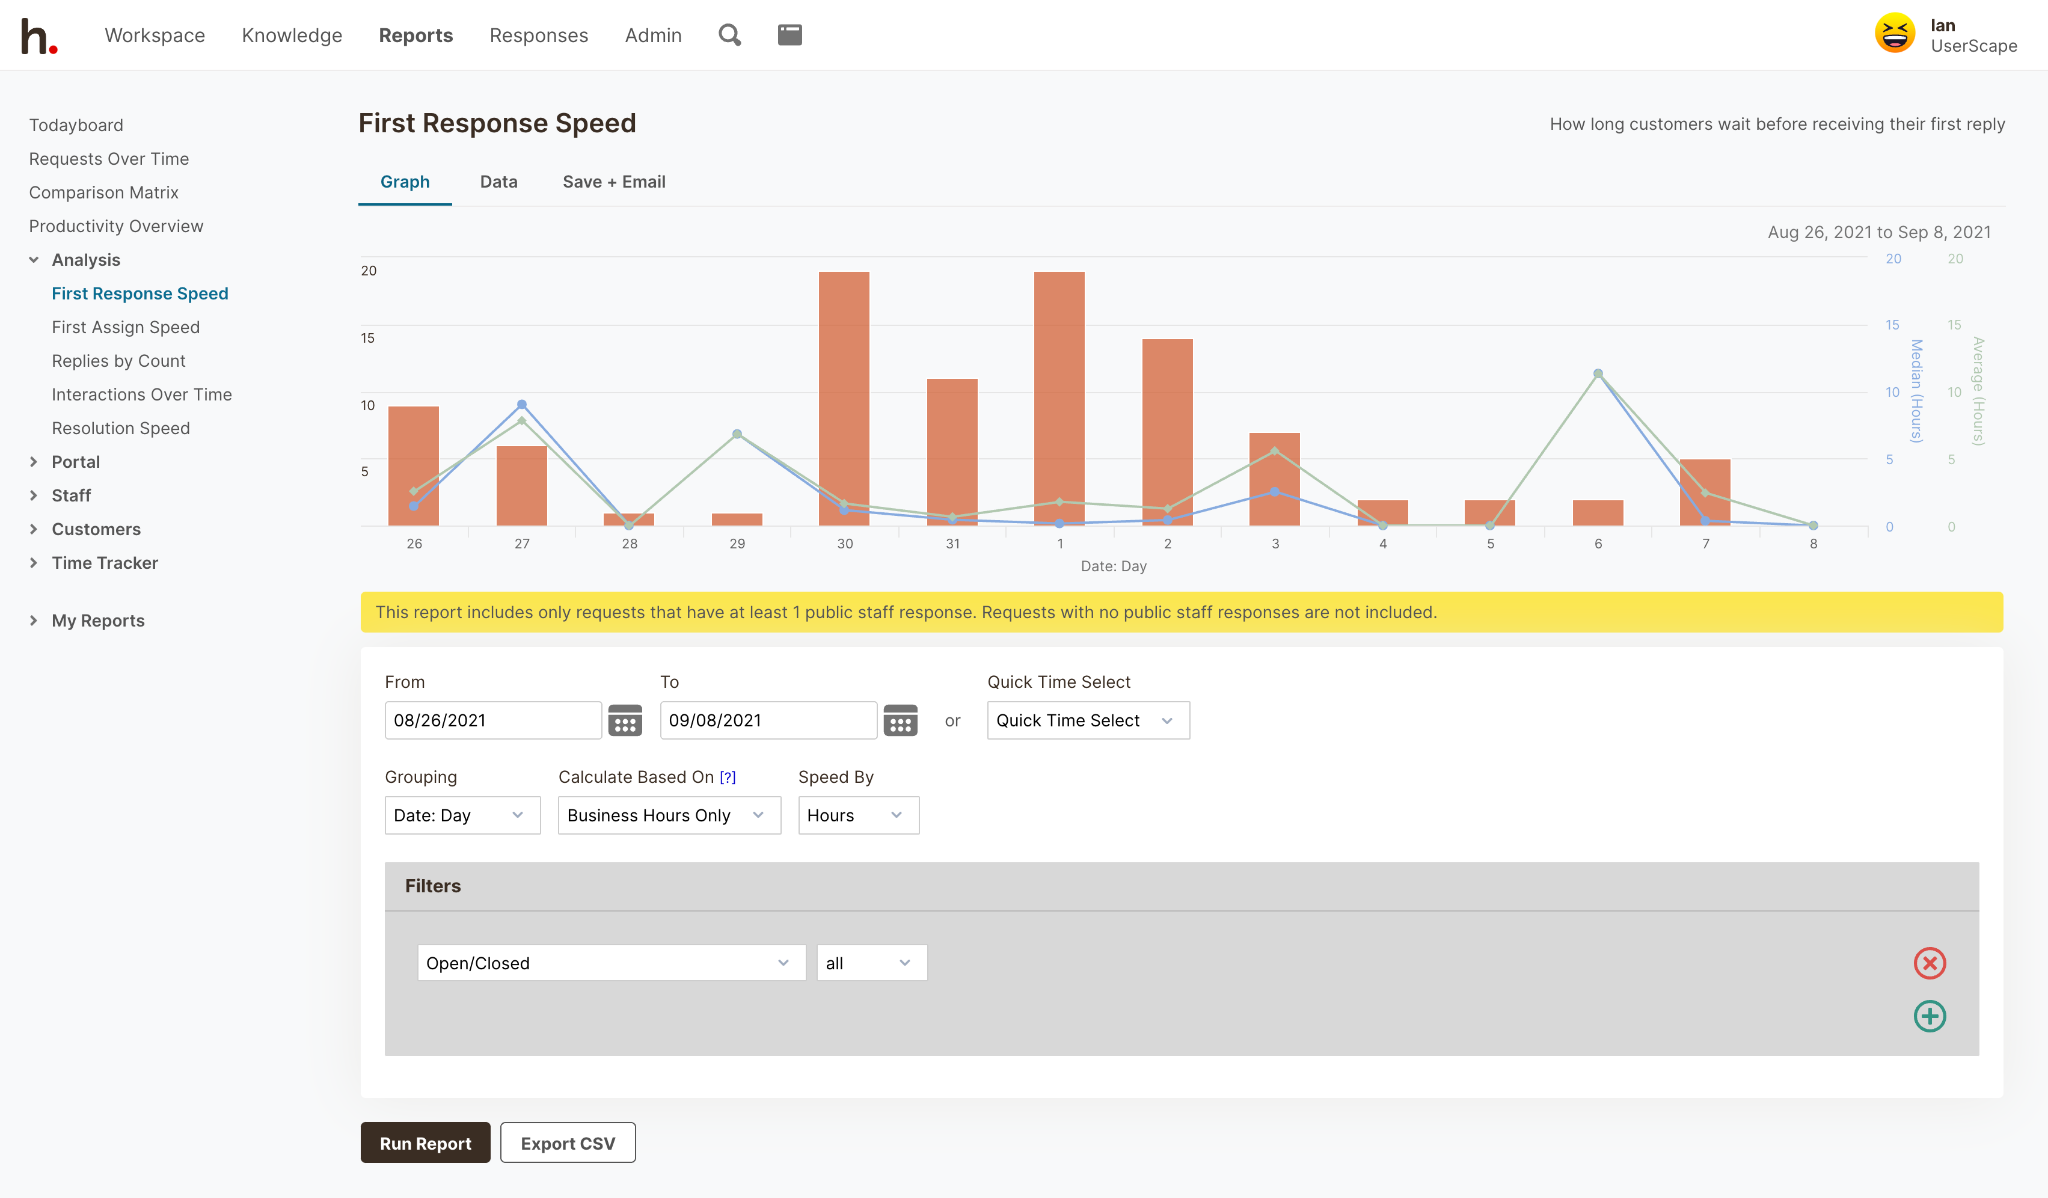 For this report — and other reports — you can choose whether to track time by business hours or all hours. If you choose to track by business hours, you can also enter holidays. This allows you to track response time according to when someone was available.
(However, the customer still has to wait even if no one is available, so including all hours may be a better way to track customer satisfaction.)
The ‘Resolution Speed’ report includes bars representing the total number of emails for a given period and lines that represent the average handle times and median handle times until full resolution.
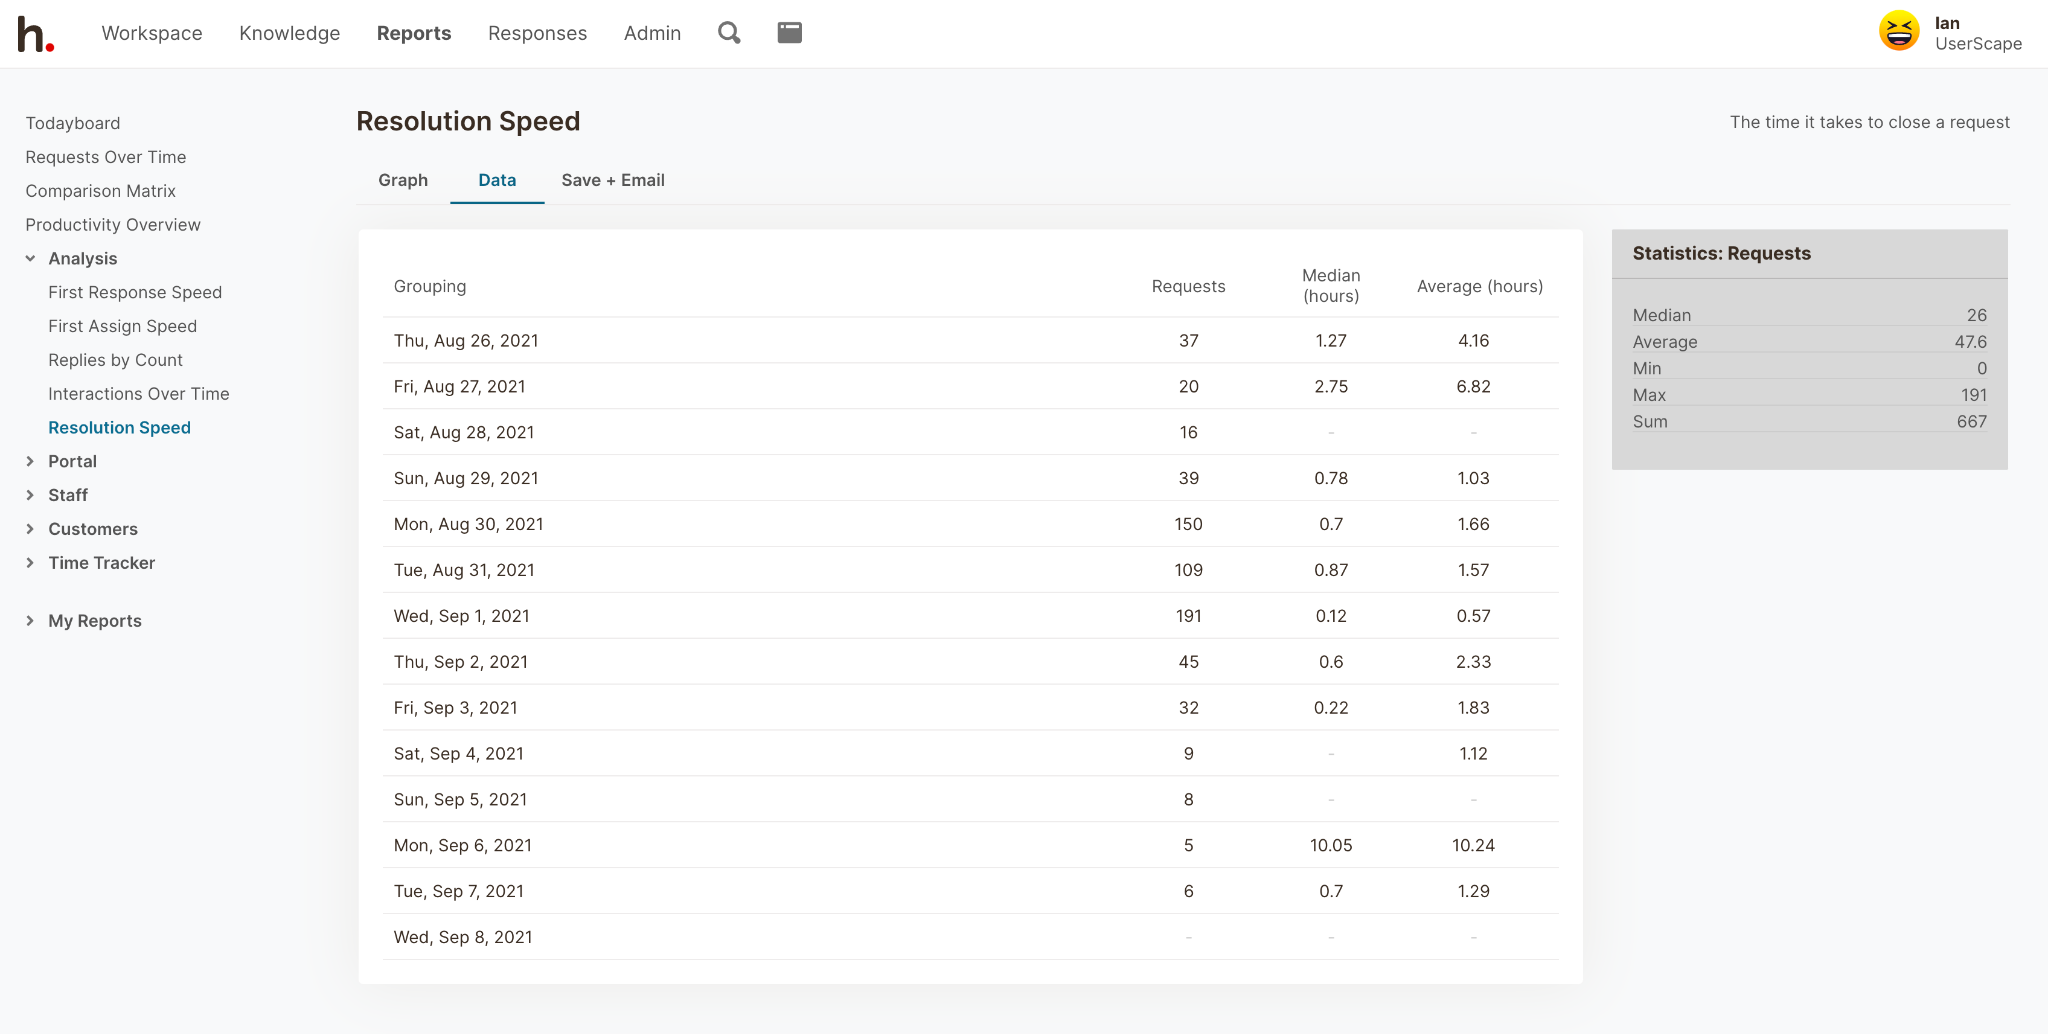 The total number of emails is included because it often directly affects resolution times.
For example, if more requests than usual come in, you can expect longer resolution times. If the number of emails stays consistently high and the resolution times are longer than you want them to be, it could indicate you need to hire more people.
You’ll also have insight into which topics take longer to resolve and which individuals have slower resolution rates. With this information, you can plan more training for particular topics or individual employees.
 Most CSAT’s are basic key performance indicators (KPI) for whether your customers are satisfied or unsatisfied. CSAT scores are compared to the industry benchmark as a way to evaluate success.
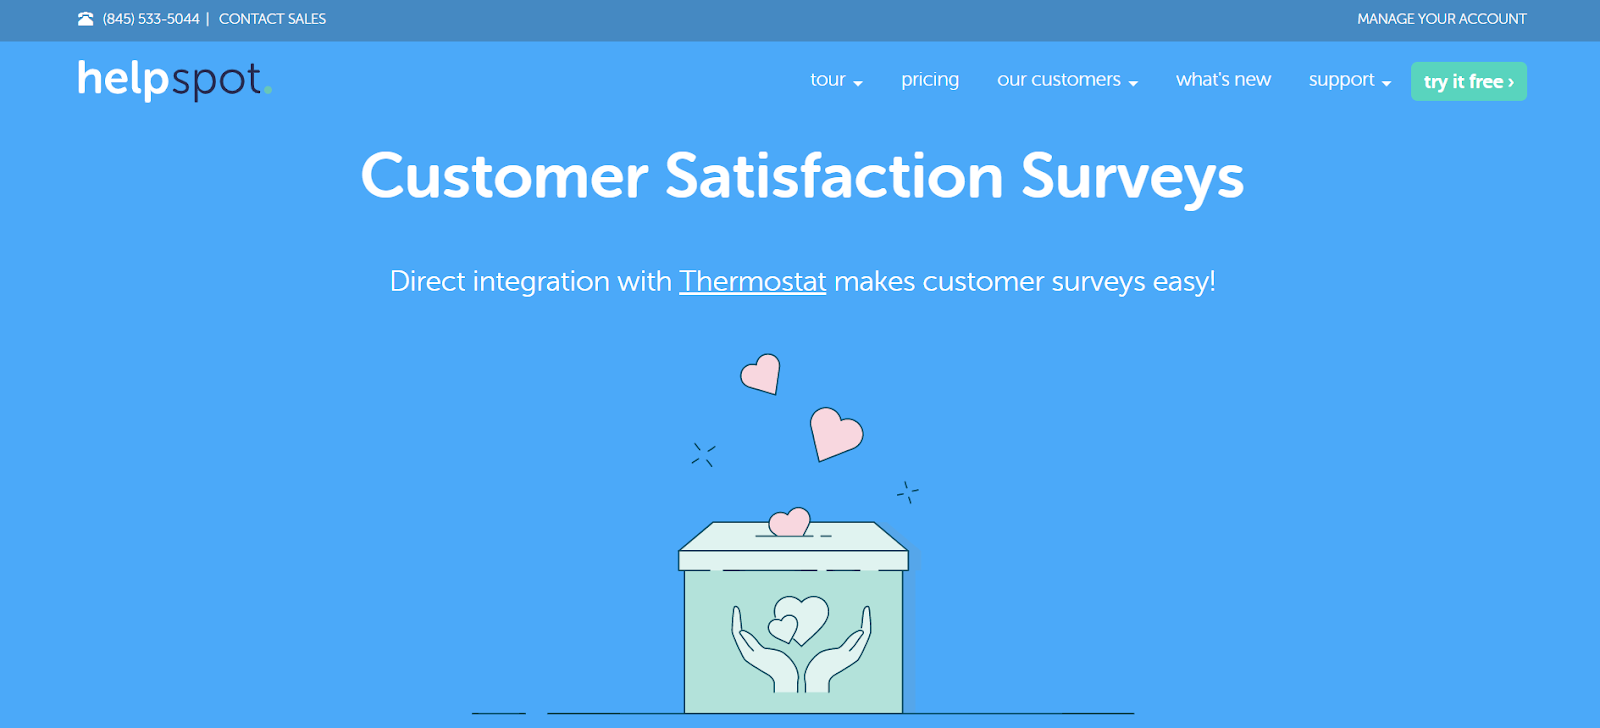
HelpSpot’s sister software, Thermostat, expands on this idea by using net promoter scores (NPS) to focus on whether or not your customers are likely to recommend your product and their long-term loyalty. This approach is more effective for building positive relationships with your customers and sustaining your organization long-term.
Thermostat uses a simple survey to gather and evaluate various customer service metrics. The data can then be manipulated in Thermostat or through real-time integration with HelpSpot.
Once you’ve become familiar with the reports mentioned above, you may want to answer more complex questions, such as:
The best customer service software feature for answering these types of questions is HelpSpot’s ‘Comparison Matrix’. You’ll also need simple ways to share any of these reports, which HelpSpot provides as well.
The Comparison Matrix lets you cross-reference any data and displays the results on a heat map matrix.
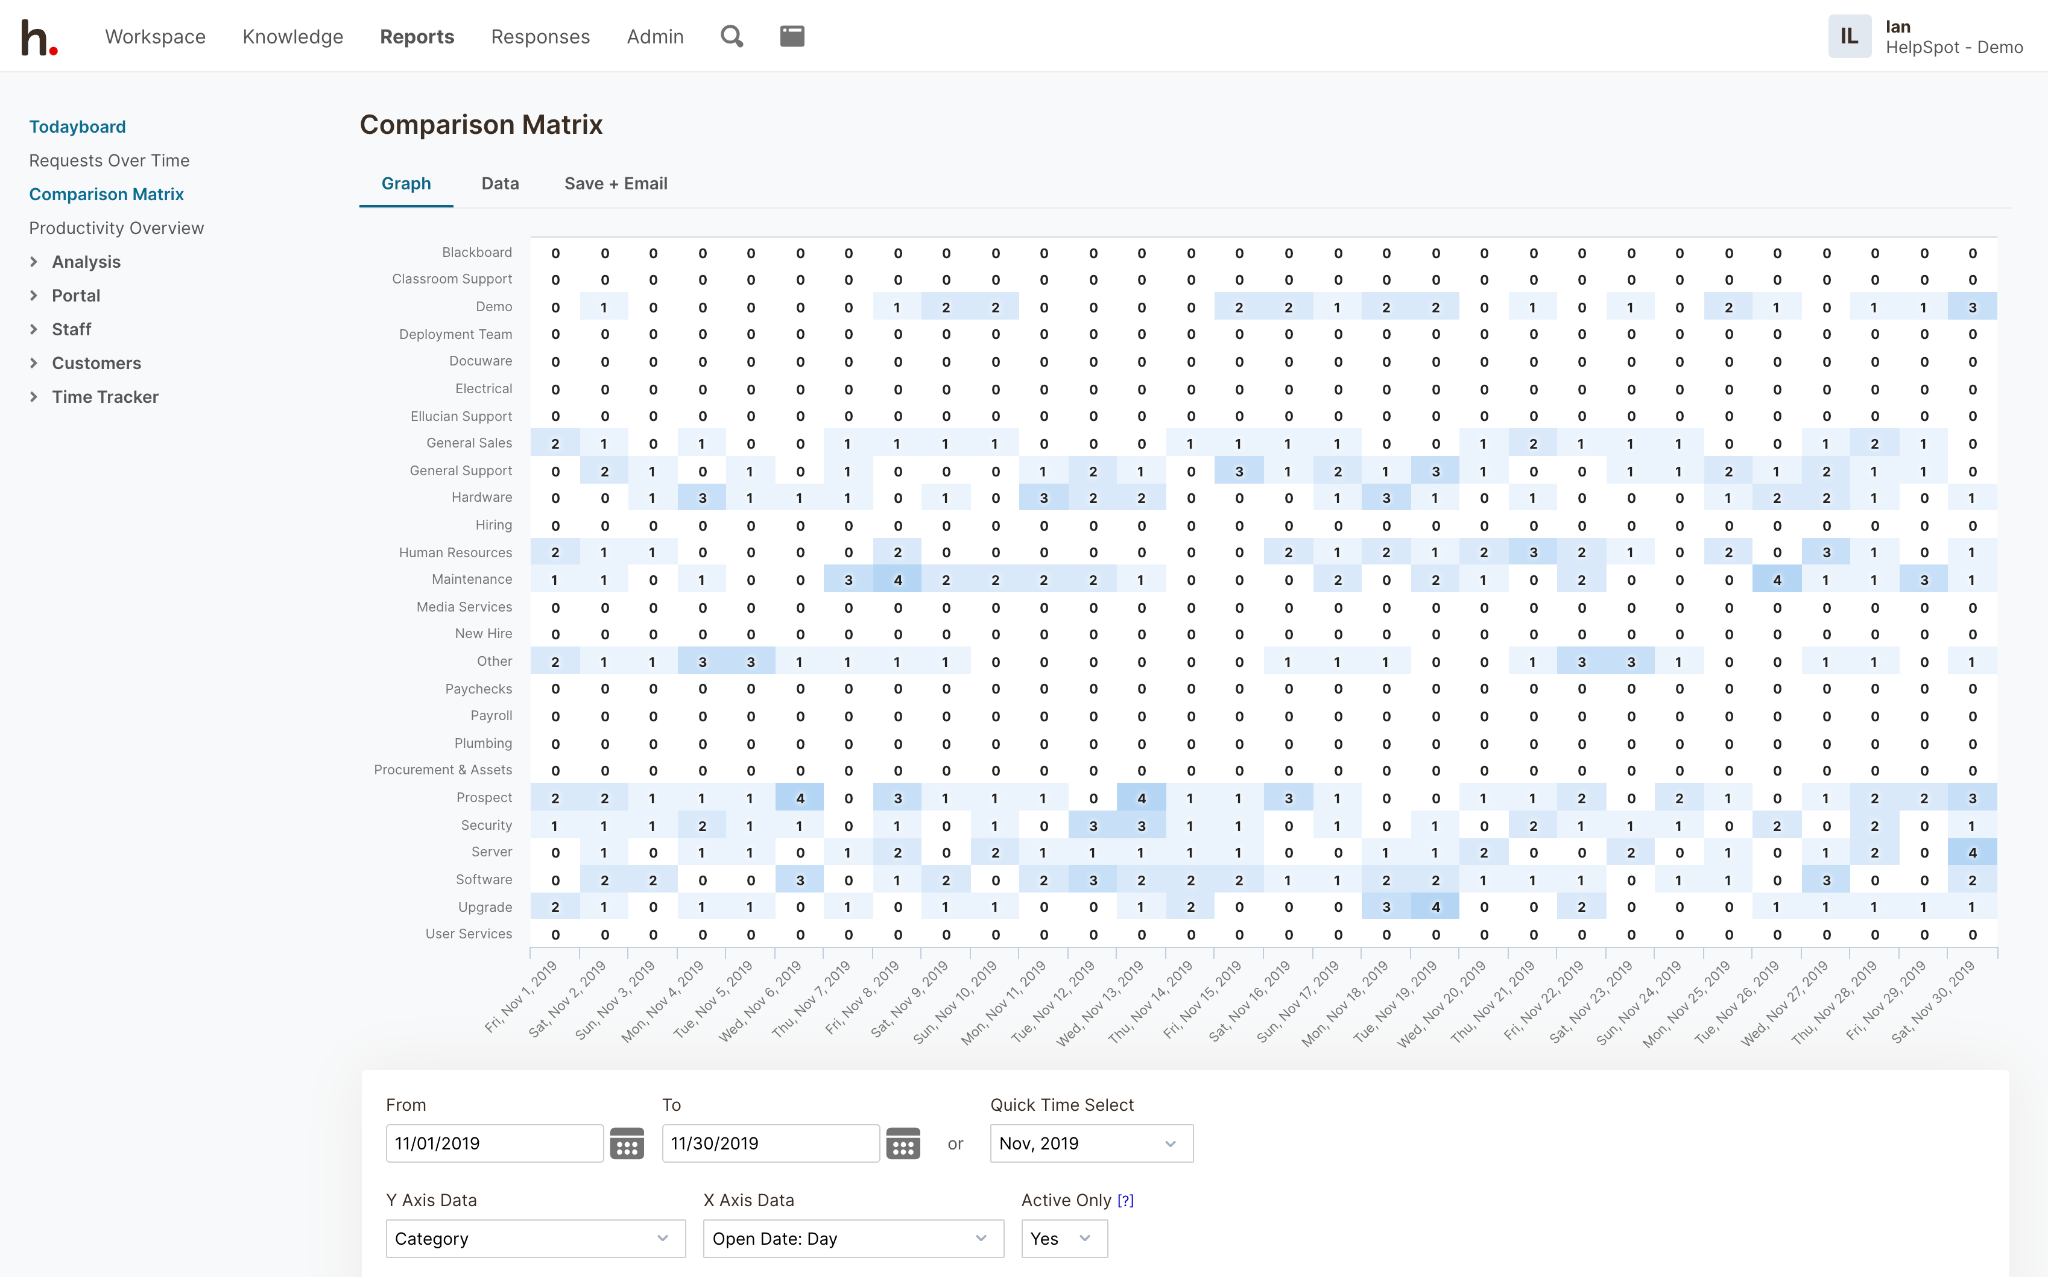 This is useful for noticing trends and relationships between different sets of data.
For example, you could see what your busiest days of a particular month were and who took on the most emails on those days. Another example would be creating a report that shows you how many emails each support agent is answering on each topic.
Like the other reports, you can apply numerous filters to create nearly endless custom reports. With these reports, you can make informed decisions about any questions that may arise.
Once you’ve created a report, you have the option to view it as raw data or in a graph. You can save any report to ‘My Reports’ making it easier to find and use the report the next time you need it. Any report can be exported to your desktop so that you can manipulate the data or create your own graph.
You can also schedule any report to be emailed out at any time, to anyone. You could walk into your office every morning and have a report in your inbox that shows you the total number of emails your customer service team handled yesterday. If your boss wants to see average response times each month, you can automate that report to be emailed, too.
Customer service reporting is necessary for tracking great customer service metrics and employee satisfaction. HelpSpot’s email management software offers the perfect combination of pre-built and customizable reports that allow you to hone into each customer service agents’ performance on a given day or zoom out to see your service department’s performance over several months. By emailing or exporting the reports, you’ll always have them where and when you need them to improve overall workflow.
Get the reports you need by starting a free trial with HelpSpot**.