Help Desk Reporting: Key Support Metrics and How to Use Them
The reporting feature is one of the most beneficial help desk tools because it gives you hard data about (1) incoming tickets, (2) customer issues, and (3) how the staff works together to respond to tickets and resolve those issues.
However, most help desks only offer the basics in terms of reporting. You can look at metrics like the number of new requests and average resolution time, but you can’t customize reports to dig into any of the data.
For example, say you want to know what the busiest hours of the day were for your sales and operations departments; to get data on this, you either have to supplement with another reporting tool or rely on feedback from your staff to fill in the gaps.
That’s why we designed HelpSpot with a customizable reporting dashboard so you can look at any data that’s relevant to your support processes. We offer a number of preset reports for a quick glance at key metrics (e.g., Interactions Per Ticket, First Response Time). Additionally, we also have tools that help you modify reports and look at data in different ways.
Not only that, but HelpSpot also integrates with reporting software Thermostat, allowing you to create satisfaction surveys and get feedback from your customer base. We also offer an open-source API so you can connect to other reporting software in your tech stack and get a consolidated view of data.
In this article, we cover the most helpful reports teams use to monitor tickets and agent performance and explain how to leverage that data to improve your support processes. Then we’ll walk you through HelpSpot’s reporting feature and talk about how your teams can use it to create and customize help desk reports.
Want to learn more about HelpSpot’s help desk reporting*?* Start a free 21-day trial and see how you can create customizable reports to better manage team performance and resolve customer issues.
Key Reports to Measure Your Team’s Performance
The right help desk reports help you answer questions like:
- How many tickets do your agents resolve every day?
- How much time are they taking to resolve the tickets?
These metrics help you understand if you need to hire more people to reduce workload or provide more training to enhance their knowledge.
Here are the six most useful help desk reports to get you started:
-
Requests Over Time: Monitors how many requests your support team receives and handles over a specified period of time (day, week, or month).
-
Interactions Per Ticket: Tracks the number of emails exchanged between your team and the customer till the issue is fully resolved. It also tracks the total number of internal interactions shared between your agents to resolve a selected ticket.
-
First Response Speed: Measures how much time a customer had to wait (after they raised the ticket) for the first reply from your team.
-
Resolution Speed: Monitors cumulative time taken from the moment a ticket was created till the time your team resolved it.
-
Average Response Time: Tracks how long the customer has to wait for an answer after each response. This report measures all consequent interactions till the complete resolution of the ticket.
-
Customer Satisfaction Scores: Monitors customer satisfaction alongside your help desk KPIs after a ticket resolution. This report is useful in evaluating the overall performance of your team and the efficiency of your help desk operations.
Use HelpSpot’s Reporting Dashboard to Track Important Metrics
HelpSpot help desk software has a modern and user-friendly layout. You can see the key email management features from the main dashboard and easily navigate to the reporting tool from the top menu bar.
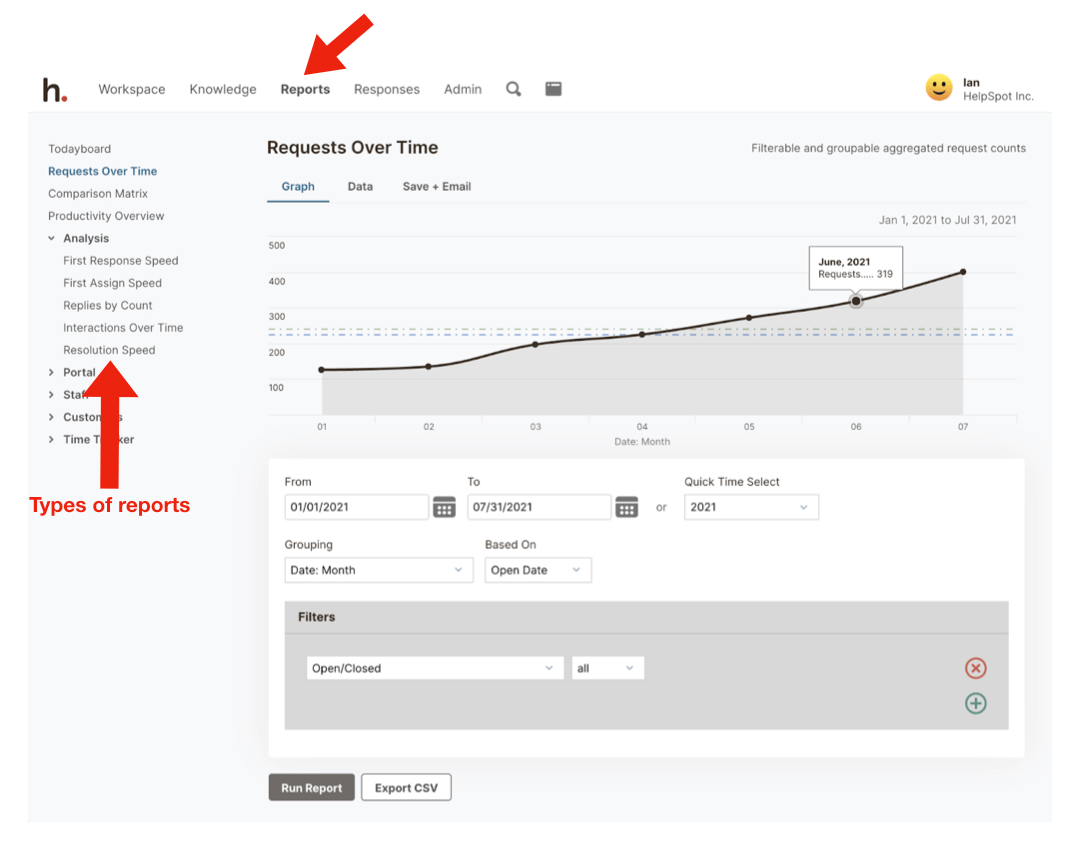 Once you click on “Reports,” you can see a list of key reports on the left side of the dashboard.
Every report comes with a default template that can be customized to pull data with filters, custom fields, and tags. Our reports automatically pull real-time data from your most recent interactions, but you can also view reports across different timeframes.
In the next section, we’ll show you how each of the reports listed above works in HelpSpot, their benefits, and customization options.
Requests Over Time: Total Number of Tickets Your Staff Receives
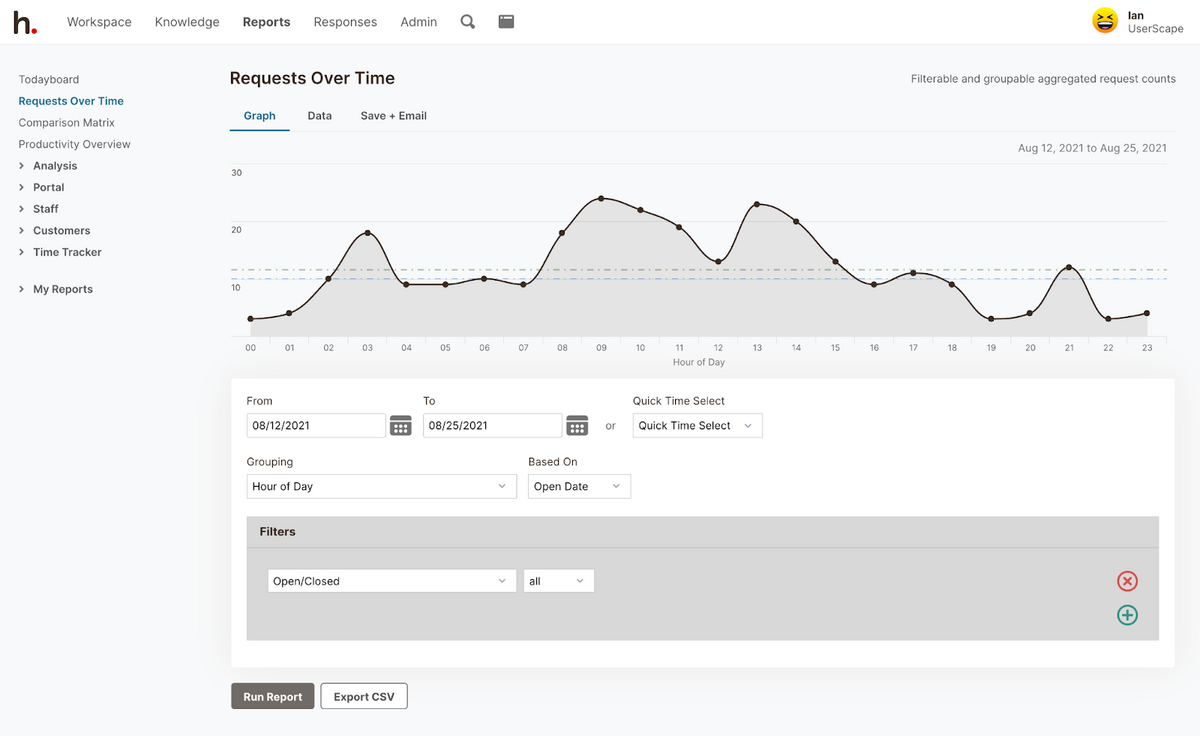
The Requests Over Time report gives you real-time data on the total number of emails you receive. You can filter volume reports to view emails by category, customer, assigned user, and date (you can even specify which time of day).
For example, you can filter to view data about your busiest days of the week, and busiest hours of the day.
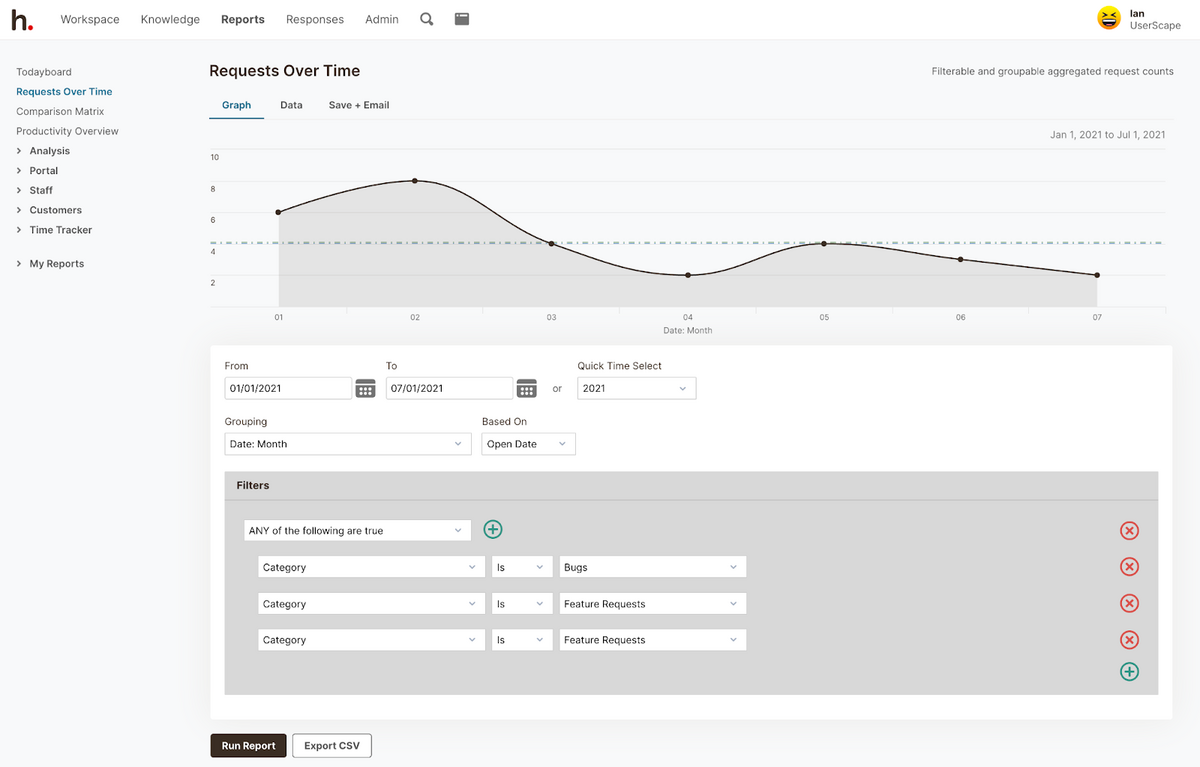
 You can also choose to drill down ticket volume with categories and tags.
For example, in a university, the HR department can find out how many requests they received in a day, week, month, or year. In the same way, other departments like IT, admissions, and management can filter their own service requests.
Read More: HR Ticketing System: Manage HR Requests with HelpSpot
Even in HR, you can see ticket volumes in different areas; for example, you can see the number of tickets raised for issues concerning leave policy, insurance, or payroll.
 There are two benefits that the Requests Over Time reports offer:
-
Manage your team’s workload: For example, say Wednesdays and Thursdays from 3 to 5 p.m. are your busiest hours. You can either add more agents as part-time employees or create a staffing schedule to distribute work evenly (and avoid overwhelm).
-
Gain insight into frequent customer issues: You can see what topics or issues your customers ask about most often. Then, you can use this data to determine which resources to add to your help desk knowledge base or self-service portal for end-users to access when they need; this improves customer experiences because users can find troubleshooting and FAQ information easily, and it minimizes the number of tickets your team receives about these issues.
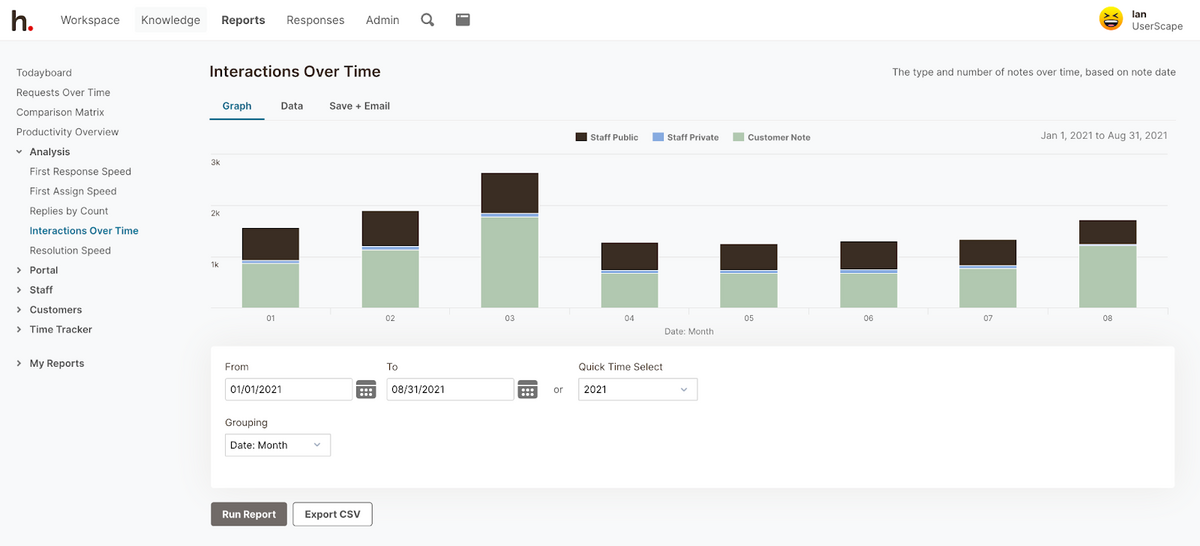
Interactions per Ticket: Total Emails between Customer & Agent till Ticket Resolution
The Interactions Over Time report measures all ticket activity — including internal notes and email replies — so you can see the steps agents take to resolve customer issues. If a ticket has an unusually high number of interactions, you can dig into the issue to see if your agents have the resources to resolve all ticket requests effectively.
You can also use this report to determine if your agents need extra training in a particular area. For example, say a healthcare team using help desk reporting notices their tickets about insurance policies have a high number of internal notes between staff, they can look at the questions agents have and offer extra training on those policies.
 In addition, tags and filters help you drill down on specific data. Say, within the ‘insurance policies’ category, you have more tickets on disability insurance than accident insurance; you can add more documentation on disability insurance policies to your self-service portal for staff and customers to access.
Finally, to diagnose tickets with longer resolution times, you can review the email exchanges between the customer and agent. This data can help you figure out what could have been done better or differently to resolve the ticket more quickly.
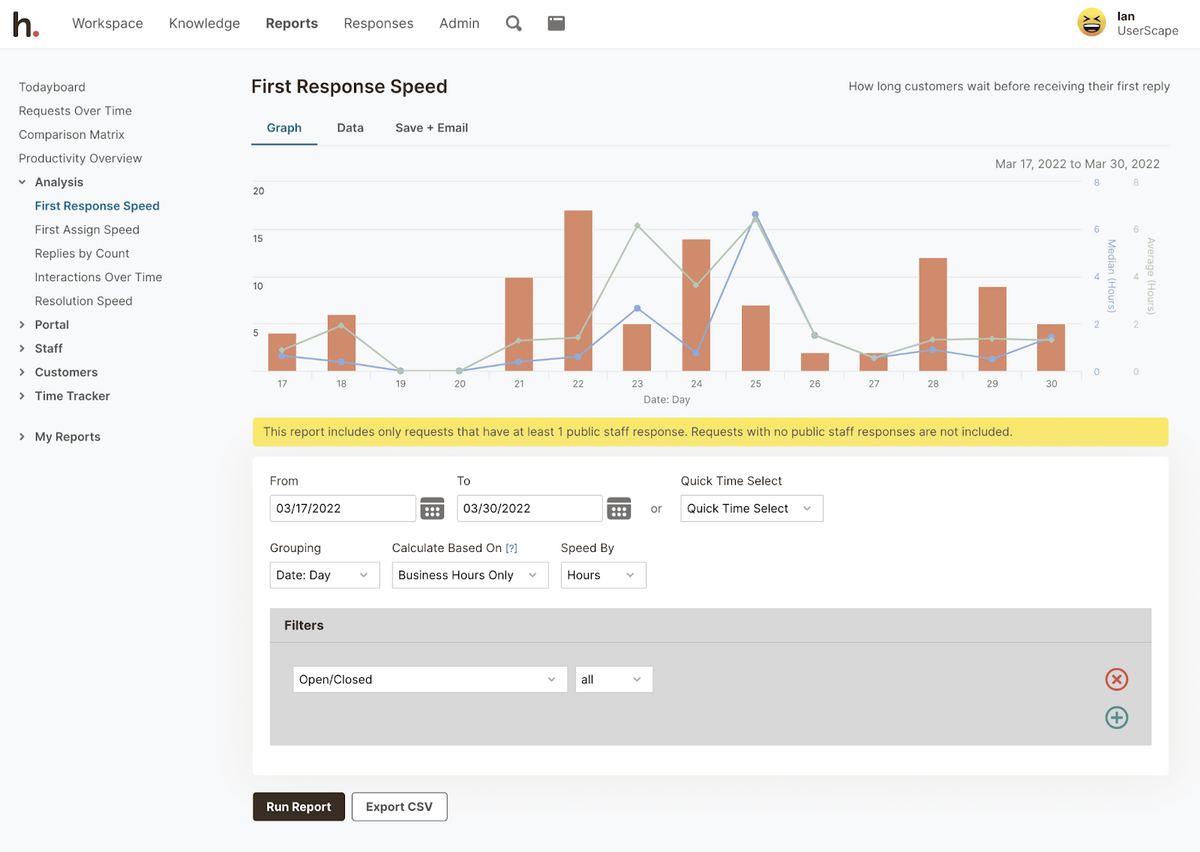
First Response Speed: How Long It Takes to Send the First Reply
The First Response Speed report measures how long it takes to send the initial response after the ticket is submitted.
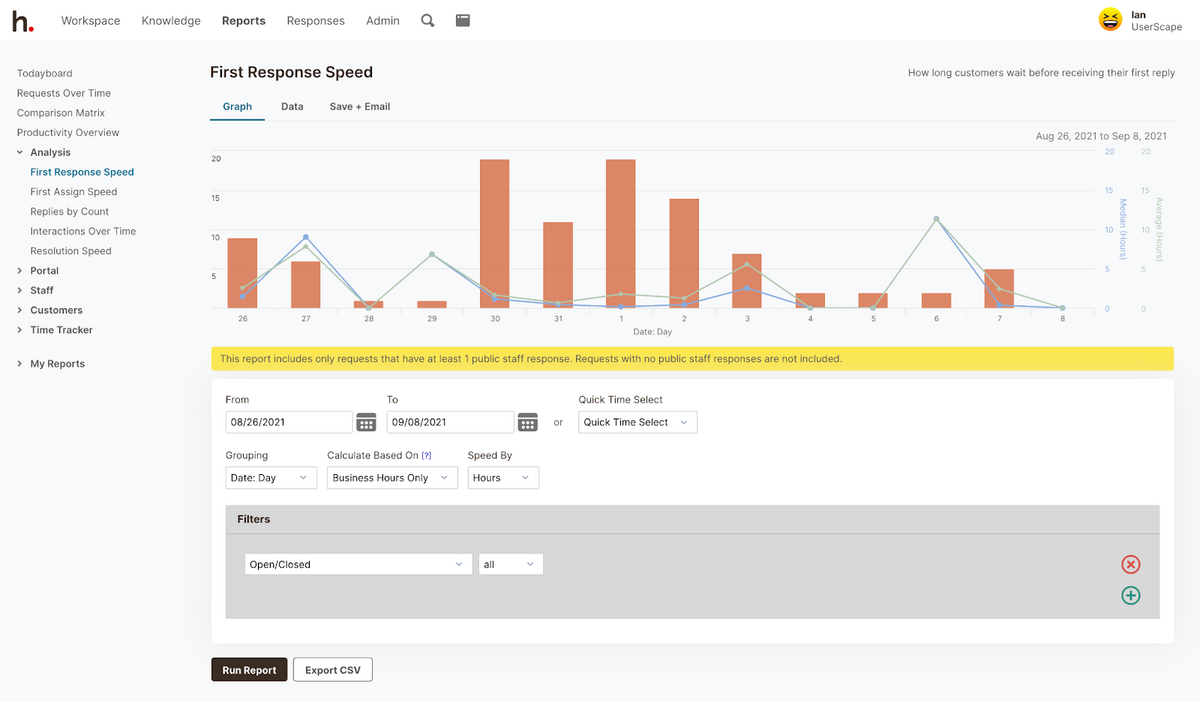 You can choose to track First Response Speed with business hours or all hours. Tracking with business hours allows you to measure response times only when agents are available; so you can count out off hours and holidays and get a more accurate look at agent performance.
With this report, you can keep your team’s response time in check. If you find tickets with slower response times, you can investigate the reason for the delay: Were agents backed up because of a sudden influx of emails? Were you experiencing technical glitches at the time? Did you have multiple agents out that day? Then, you can find workarounds for those delays and improve response/resolution times for all tickets.
Resolution Speed: Average Time to Close a Ticket
The Resolution Speed report displays bars and lines that represent two types of help desk metrics: Bars measure the total number of incoming emails, lines track the average and median resolution times — and you can customize this report to look at speed reports over different time periods.
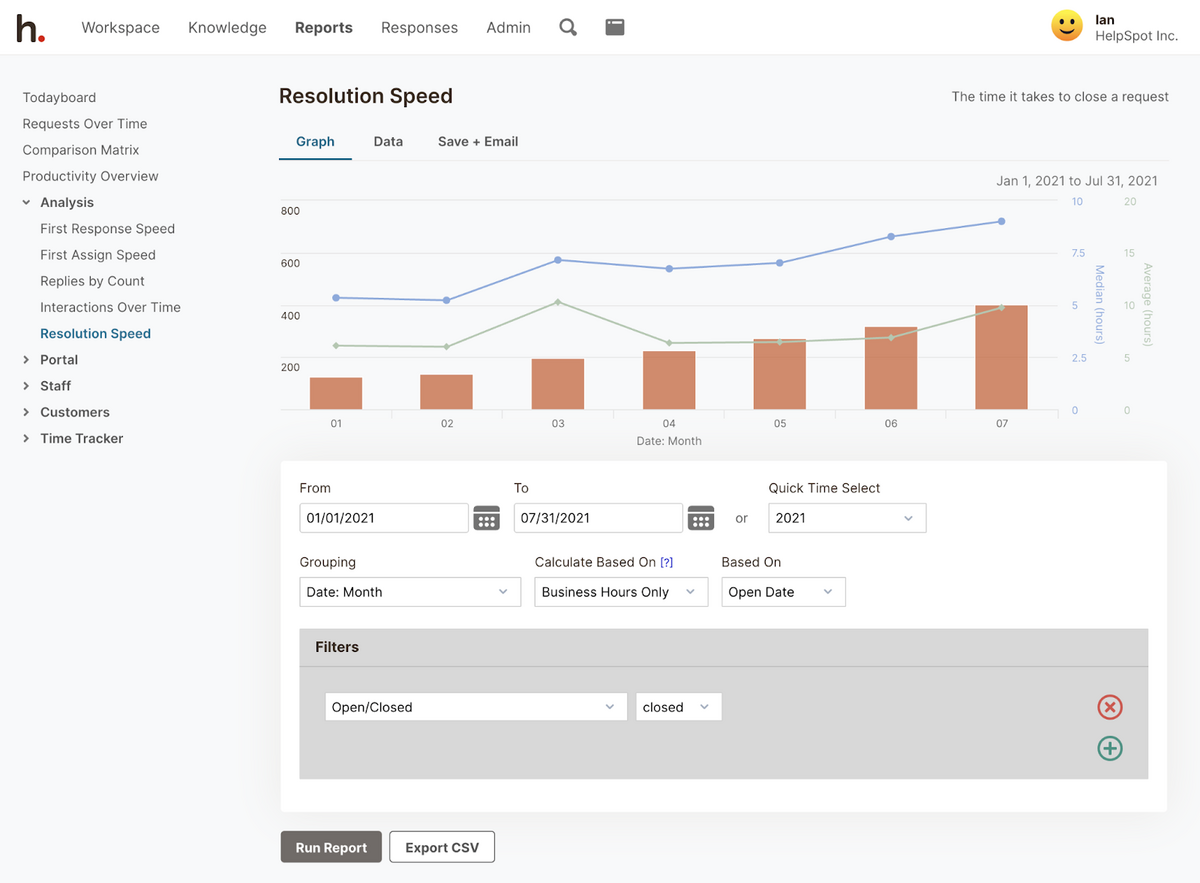 You can break this report out to look at resolution times by day, too.
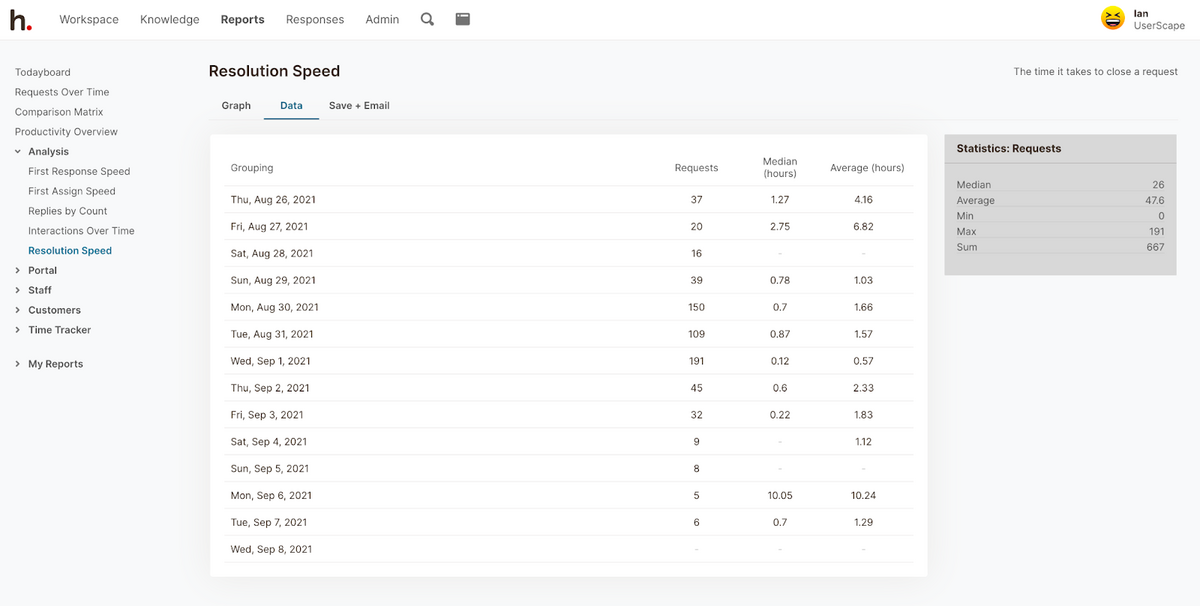 In addition, you can look into this data to see which agents have slower ticket resolution times and offer extra training to help them resolve requests more efficiently. You can also use this information to see which types of requests are more complex and require extra hands-on help from agents (like bug resolutions), and which requests agents speed through (like password resets).
We’ve seen schools and universities that use HelpSpot leverage the resolution speed reports to pinpoint inquiries that take a long time to resolve. Then, they:
-
Add knowledge base articles on these topics so agents can reference troubleshooting documentation when they need it.
-
Publish FAQs on their website to provide fast answers for users and enhance customer satisfaction.
Read More: Best Help Desk Software for Schools & Universities
Average Response Time: How Long Did Customers Wait between Agent Replies
The Average Response Time report tracks the amount of time between agent replies — or in other words, how long customers wait to hear back from agents. The Average Response Time report measures the first response time, and reply times for every subsequent response until the ticket is marked resolved.
 In addition to many other reports on this list, this report gives you greater insight into your customer support team performance and the efficiency of your help desk processes. If you notice a trend in slow response times, it might indicate that agents are overwhelmed with a backlog of tickets or don’t have the resources to promptly answer requests. In those cases, you can add extra agents or publish more knowledge base articles to ease the burden.
Additionally, you can use HelpSpot’s canned replies feature to improve the average response speed: Create templates for frequently asked questions, and when you receive similar tickets in the future, you can insert the corresponding template, quickly personalize it (if you need), and send it off.
Customer Satisfaction Scores: Easily Measure How Satisfied Your Customers Are with Your Service
Customer satisfaction (CSAT) scores usually evaluate basic key performance indicators for whether your customers are satisfied with your service. However, HelpSpot’s sister software, Thermostat amplifies this idea and measures CSAT scores with Net Promoter Scores (NPS) — NPS helps you measure if your customers are going to refer your product to their family or friends.
With Thermostat, you can quickly create one-question surveys to evaluate various customer support metrics. There’s also an option to add an open-ended feedback question (i.e. “What is the most important reason for your score?”). Not only this, you can customize your surveys according to your organizational branding.
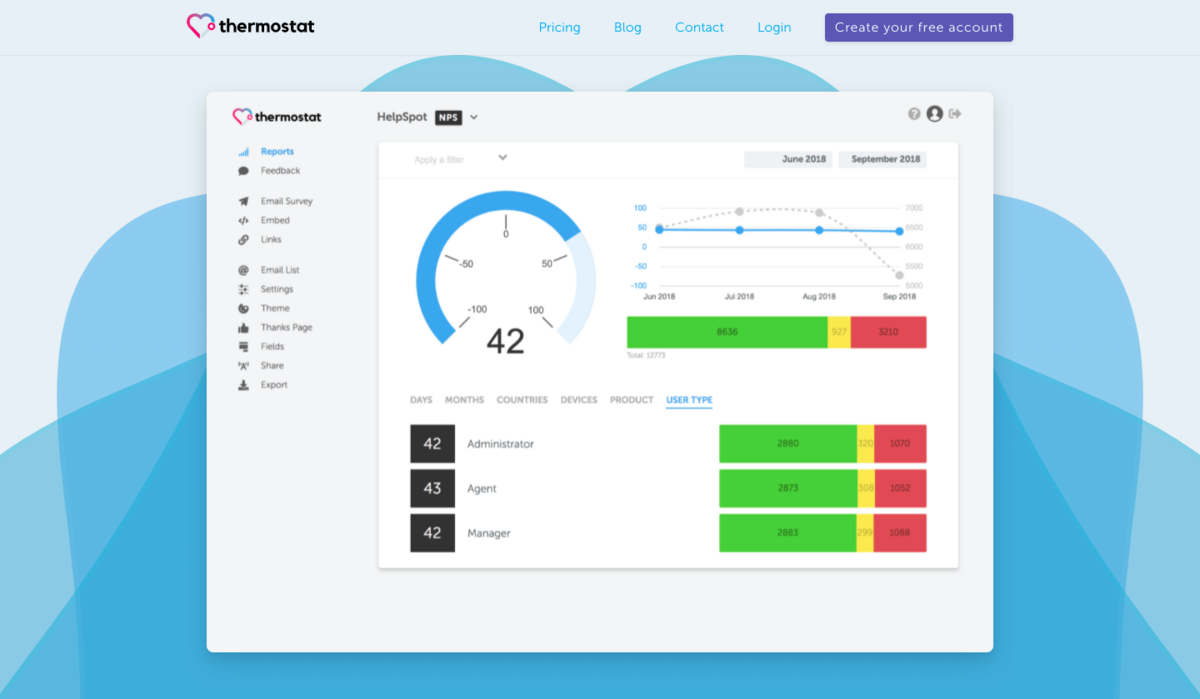 Finally, you can integrate Thermostat with HelpSpot to incorporate that information into your help desk reporting, but you can also manipulate the collected data in Thermostat.
Bonus Features: Comparison Matrix & Easy Report Sharing Options
HelpSpot also offers a Comparison Matrix that helps you visualize your service desk reporting data in an easy-to-consume format. Then, once you create reports, you can share them with anyone, anytime.
Comparison Matrix: Cross-Monitor Agent Performance, Workload, & Other Metrics
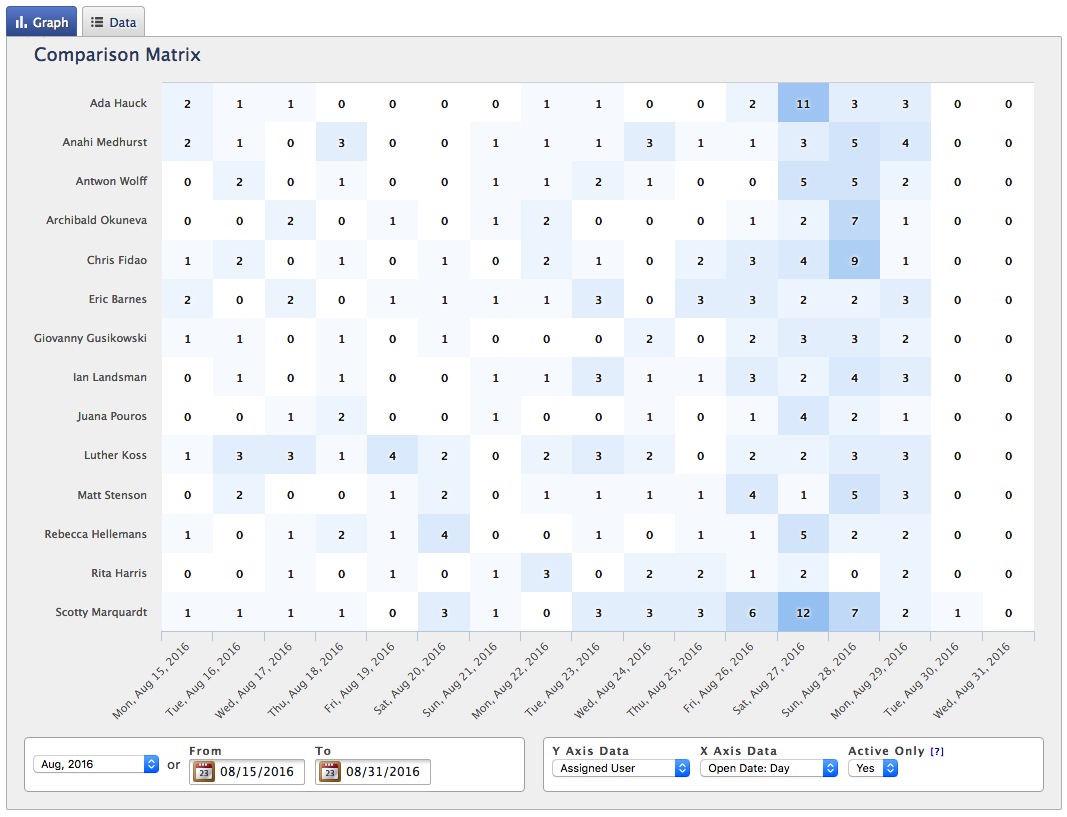
You can use the Comparison Matrix report to cross-reference data sets and spot trends in your reports. Say you want to know the busiest days of the whole month, and who took on the most requests during those days — you can use the matrix to see these patterns. For example, in the image below, you can see that August 27th and 28th were the busiest, and Scotty and Ada fielded the most requests during those days.
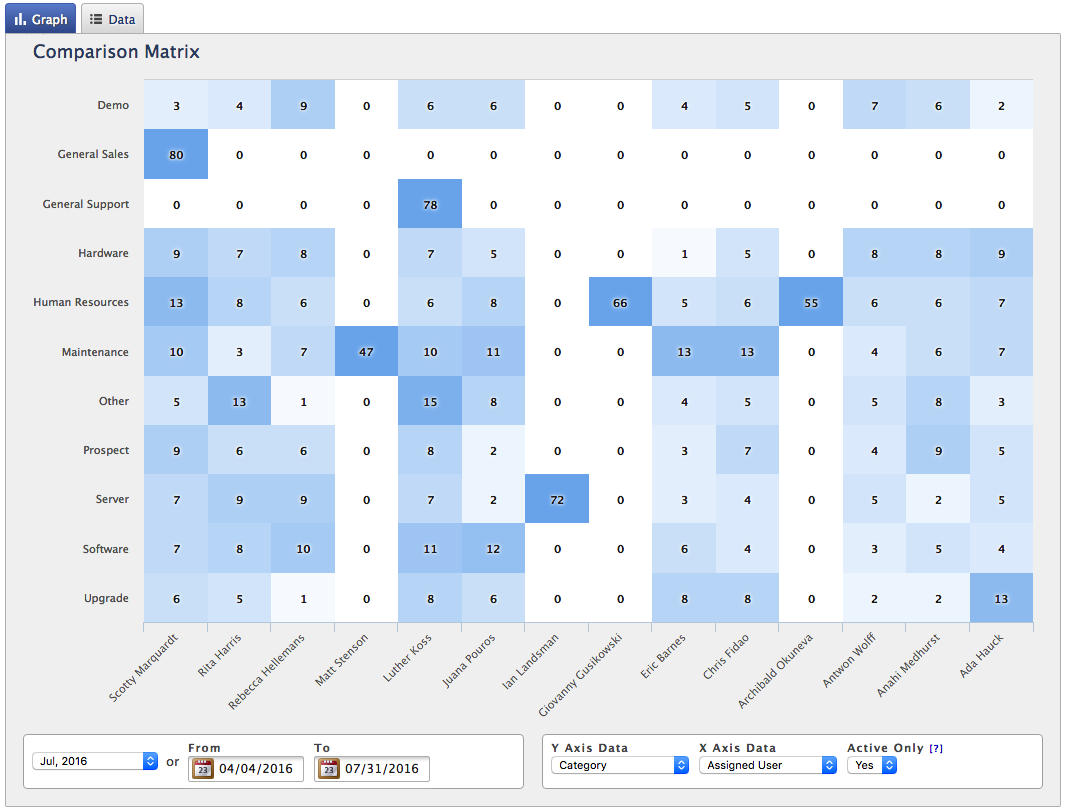
 Additionally, you use the Comparison Matrix to see how many tickets agents resolve across different categories. In the image below, you can see how many tickets were addressed in HR, general sales, general support, and hardware. Of course, as with other reports, you can adjust the time frame of Comparison Matrix reports to view this information over varying periods.
 You can also view how many tickets were raised and resolved via different communication channels (like email or chat) with the Comparison Matrix. This report makes it easy to segment performance reports on dozens of criteria and get a broader look at your help desk operations.
Free Unlimited Sharing for Help Desk Reports
With HelpSpot, creating and customizing detailed reports is easy. Once a report is created, you can view it as a graph or as raw data. Then, you can save the report to ‘My Reports’ and access it any time you want. Further, you can also download or export reports to share with others. We provide free unlimited report sharing so you can send reports without extra fees.
HelpSpot also lets you automatically schedule reports to be emailed to anyone at any frequency; this keeps everybody in the loop and ensures everybody is looking at the same data. For example, a service manager can use HelpSpot’s automation to share the key service desk reports with their team every Monday so everybody can review the previous week’s metrics and troubleshoot anything that went wrong.
Read More: 10 Best Service Desk Software in 2026 (Based on Reviews)
Start Creating Help Desk Reports with HelpSpot
Help desk reporting lets you identify how your agents are performing, where they need more support, and how happy your customers are with your brand. With HelpSpot’s help desk software, you can:
-
Customize or use pre-built templates to create reports.
-
Filter reports to drill down on the data sets that are most interesting to you.
-
View help desk reporting data in a Comparison Matrix to quickly pinpoint patterns.
-
Download reports via CSV or export reports to Excel.
-
Schedule these custom reports to be sent to yourself, other team members, or key stakeholders via email to keep everyone in the know.
These reports reveal insightful data into employee and customer satisfaction and let you view data over different time frames; but most of all, they enable you to leverage help desk performance data to optimize workflows, boost employee satisfaction, and keep your customer base happy.
Start a free 21-day trial to test HelpSpot’s email help desk features and see how our reporting tool gives you a better look at your support processes and customer issues to help your teams operate more efficiently.
The most valuable metrics include Requests Over Time, Interactions per Ticket, First Response Speed, Resolution Speed, Average Response Time, and Customer Satisfaction Scores. These tell you how your team is performing and where to improve.
Yes. Every report in HelpSpot can be customized with filters, custom fields, tags, and different timeframes. You can also use the Comparison Matrix to cross-reference data sets and spot trends.
Look for trends in ticket volume by category to identify recurring issues. Track first response time and resolution time to find bottlenecks. Compare agent workloads to balance assignments. Use customer satisfaction data to spot training opportunities.
Start with Requests Over Time to track volume, Response Time to measure speed, Resolution Time to gauge efficiency, and Customer Satisfaction to measure quality. Agent workload distribution and category breakdown reports help with staffing and process decisions.