
Filters or Reports? When to Use Each in HelpSpot
If you've ever built a filter, looked at the request grid, and thought "okay, but how many are there?", you're in very good company. "Should I use a filter or a report for this?" is one of the questions we hear most often, especially from larger teams.
And it makes sense: Filters and reports both let you set conditions, both show you requests, and both can be exported to a spreadsheet. From the outside, they're easy to confuse, so let's clear up when it's best to use reports and when it's best to use filters. In short:
Filters show you the work. Reports show you the numbers.
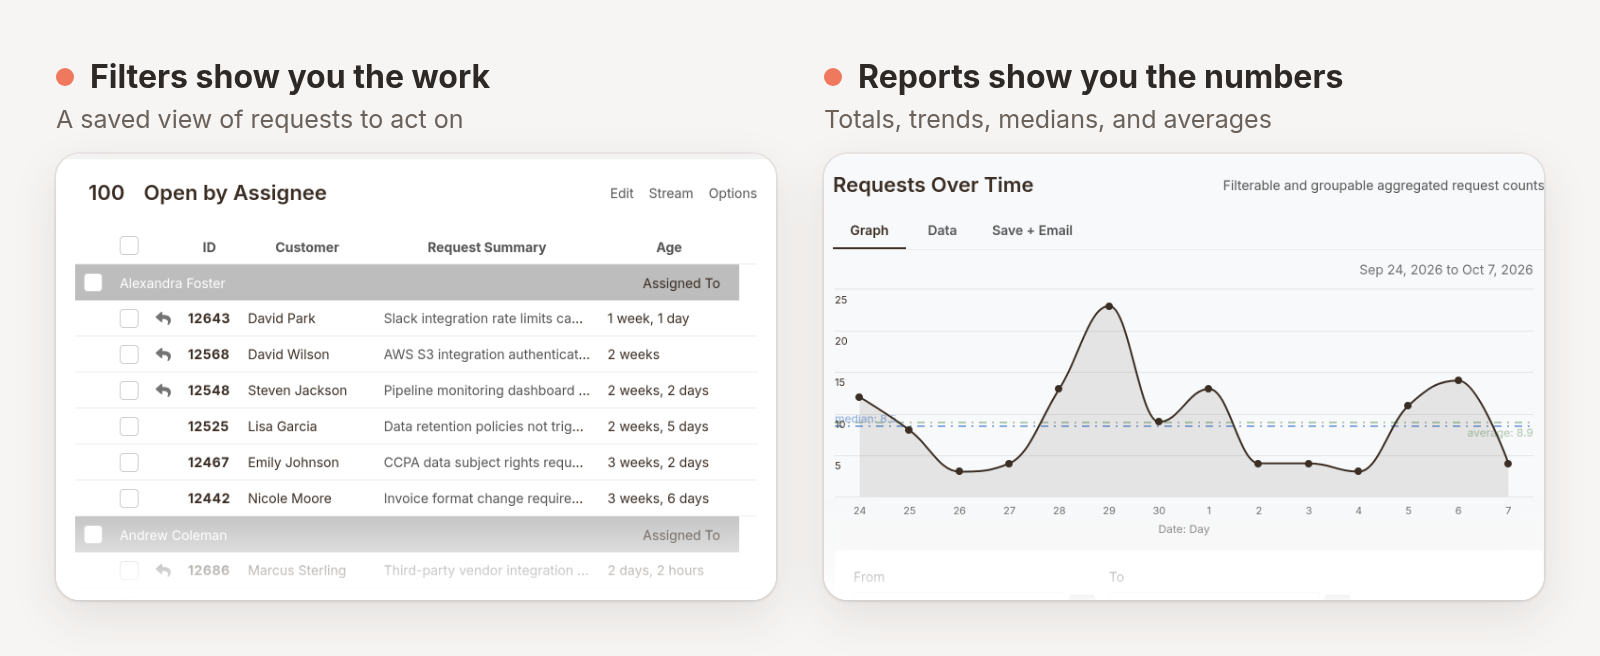
A filter answers "what needs attention right now?" while a report answers "what happened, and what does it tell us?" Most of the confusion we see in tickets comes from asking one of them to answer the other one's question.
Here's how to tell which is which, plus a few gotchas worth knowing either way.
Filters are for doing the work
A filter is a saved view of requests: a set of conditions that decides which requests show up, plus display settings that decide how they look. It lives in your left navigation, and you open it to work, not just to look.
That's why the best filters we see are built around how a team actually moves through its day. A few real examples from customers:
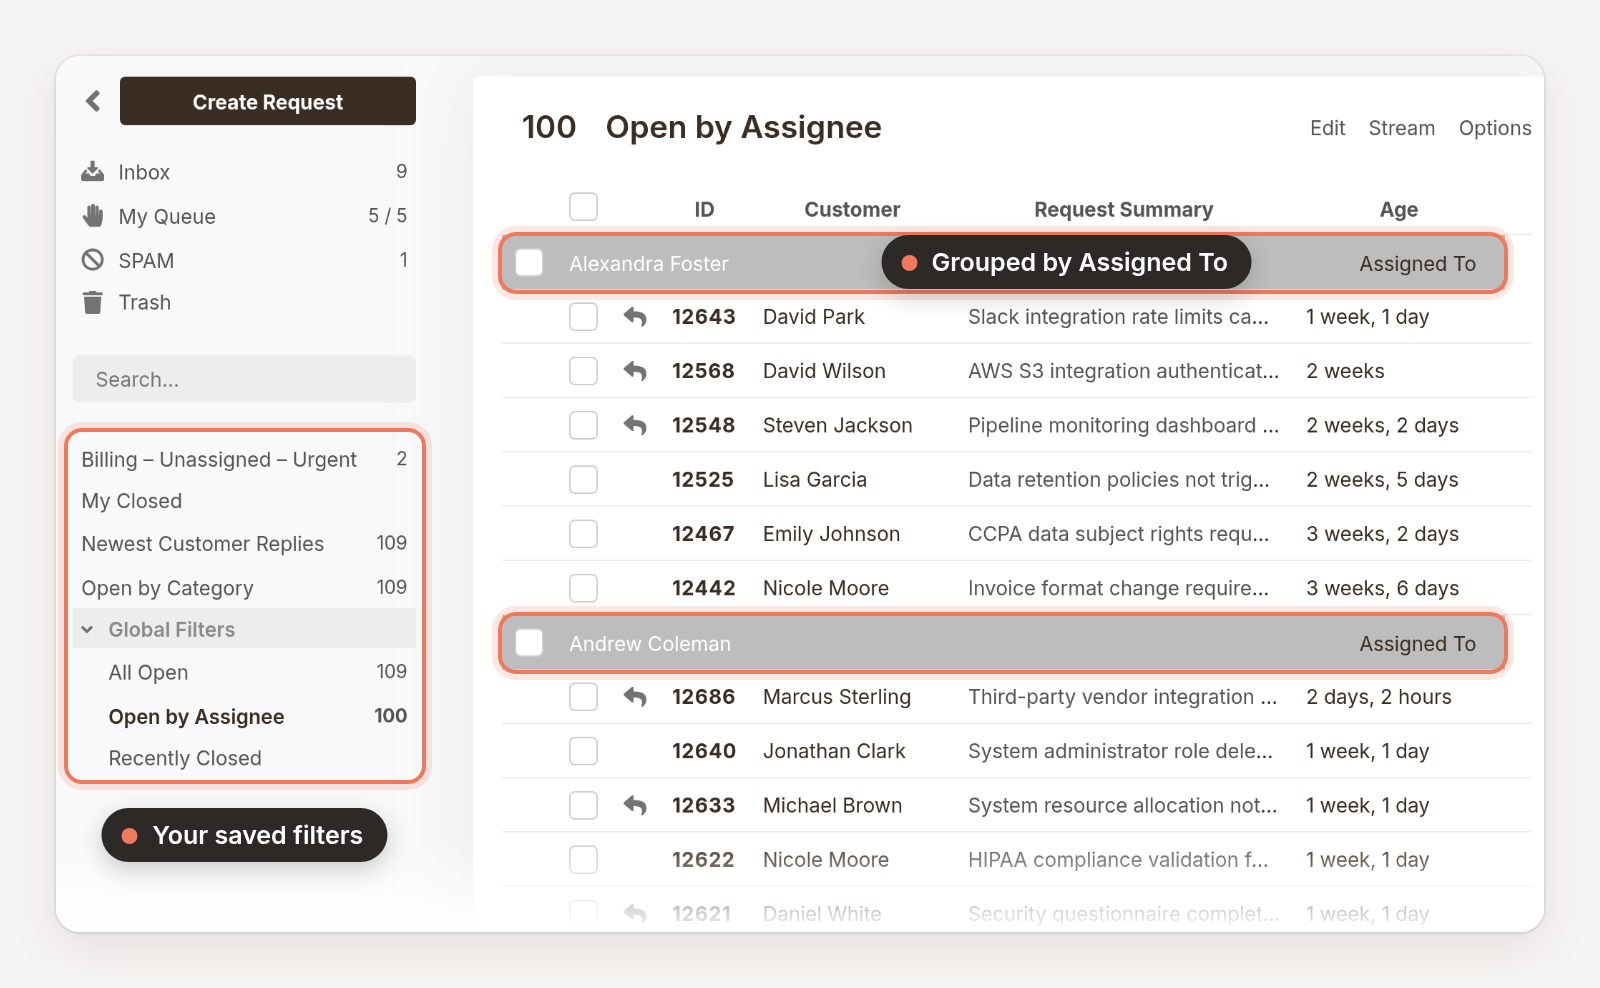
Personal views that stay put. One HR team built "Recently Closed" filters with their own columns, sorting, and grouping, then pinned them in their navigation so everyone has the same starting point every morning.
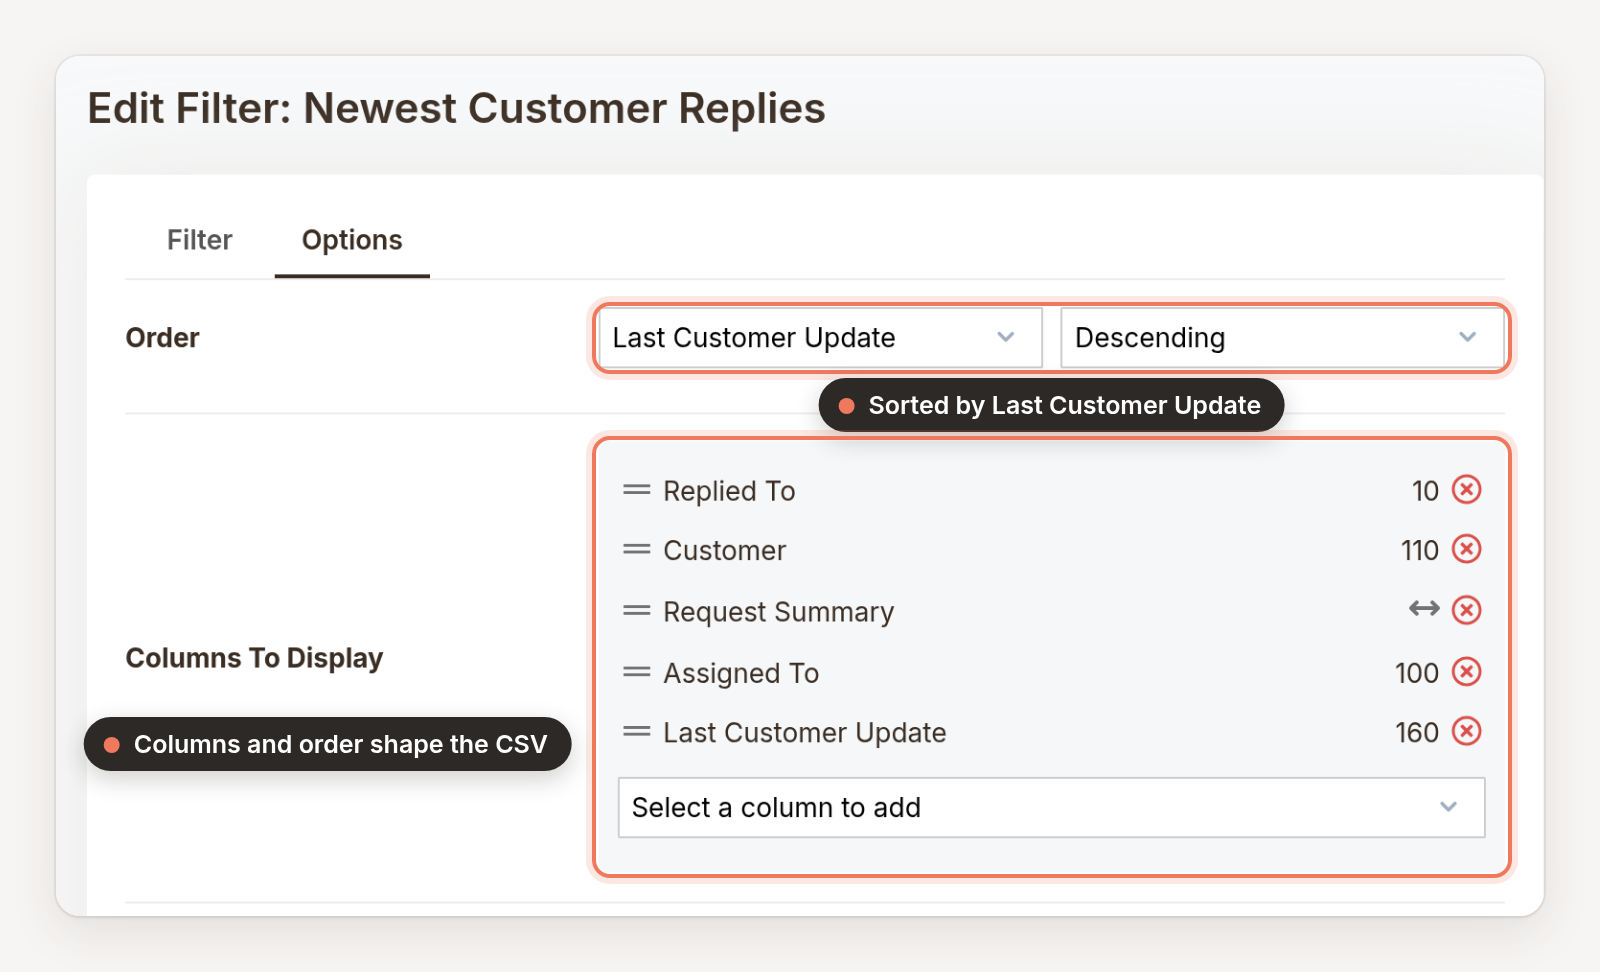
A queue sorted the way you think. Another customer wanted their newest customer replies at the top of their queue, no matter how old the request was. A custom filter sorted by Last Customer Update did exactly that, and they've been working from it since.
A dashboard per person. An IT team wanted to see each staffer's open work at a glance. A filter with an assignee condition, grouped by assignee, gave them a dashboard-style view without leaving the workspace.
Filters are also great investigation tools. One customer wanted to understand some first-response times that looked way off, so they built a temporary filter by assignee and date range, then opened up the request history on each one. The report numbers were right (it turned out to be a process issue, not a data issue). The filter just helped them see why.
Reports are for understanding the work
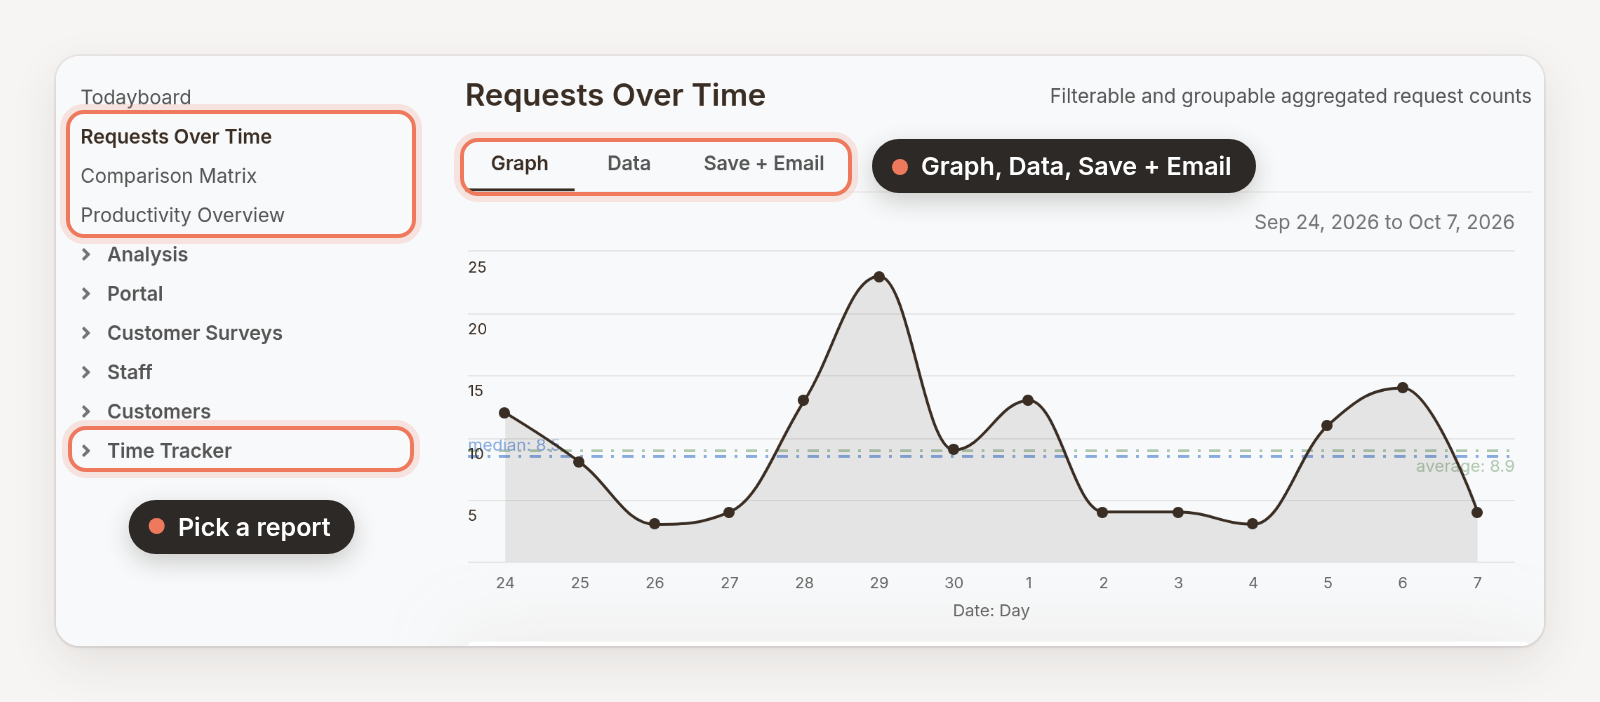
Reports aggregate. Instead of a list of requests to act on, you get a graph, totals in the Data tab, and medians and averages where they make sense. You can set the date range, add conditions to narrow things down, save a report to run again, and export to CSV.
This is where you go when the question is about your team, your volume, or your trends:
Requests Over Time is probably the best overall look at activity on your help desk, and it can group results by time period, request detail, or custom field.
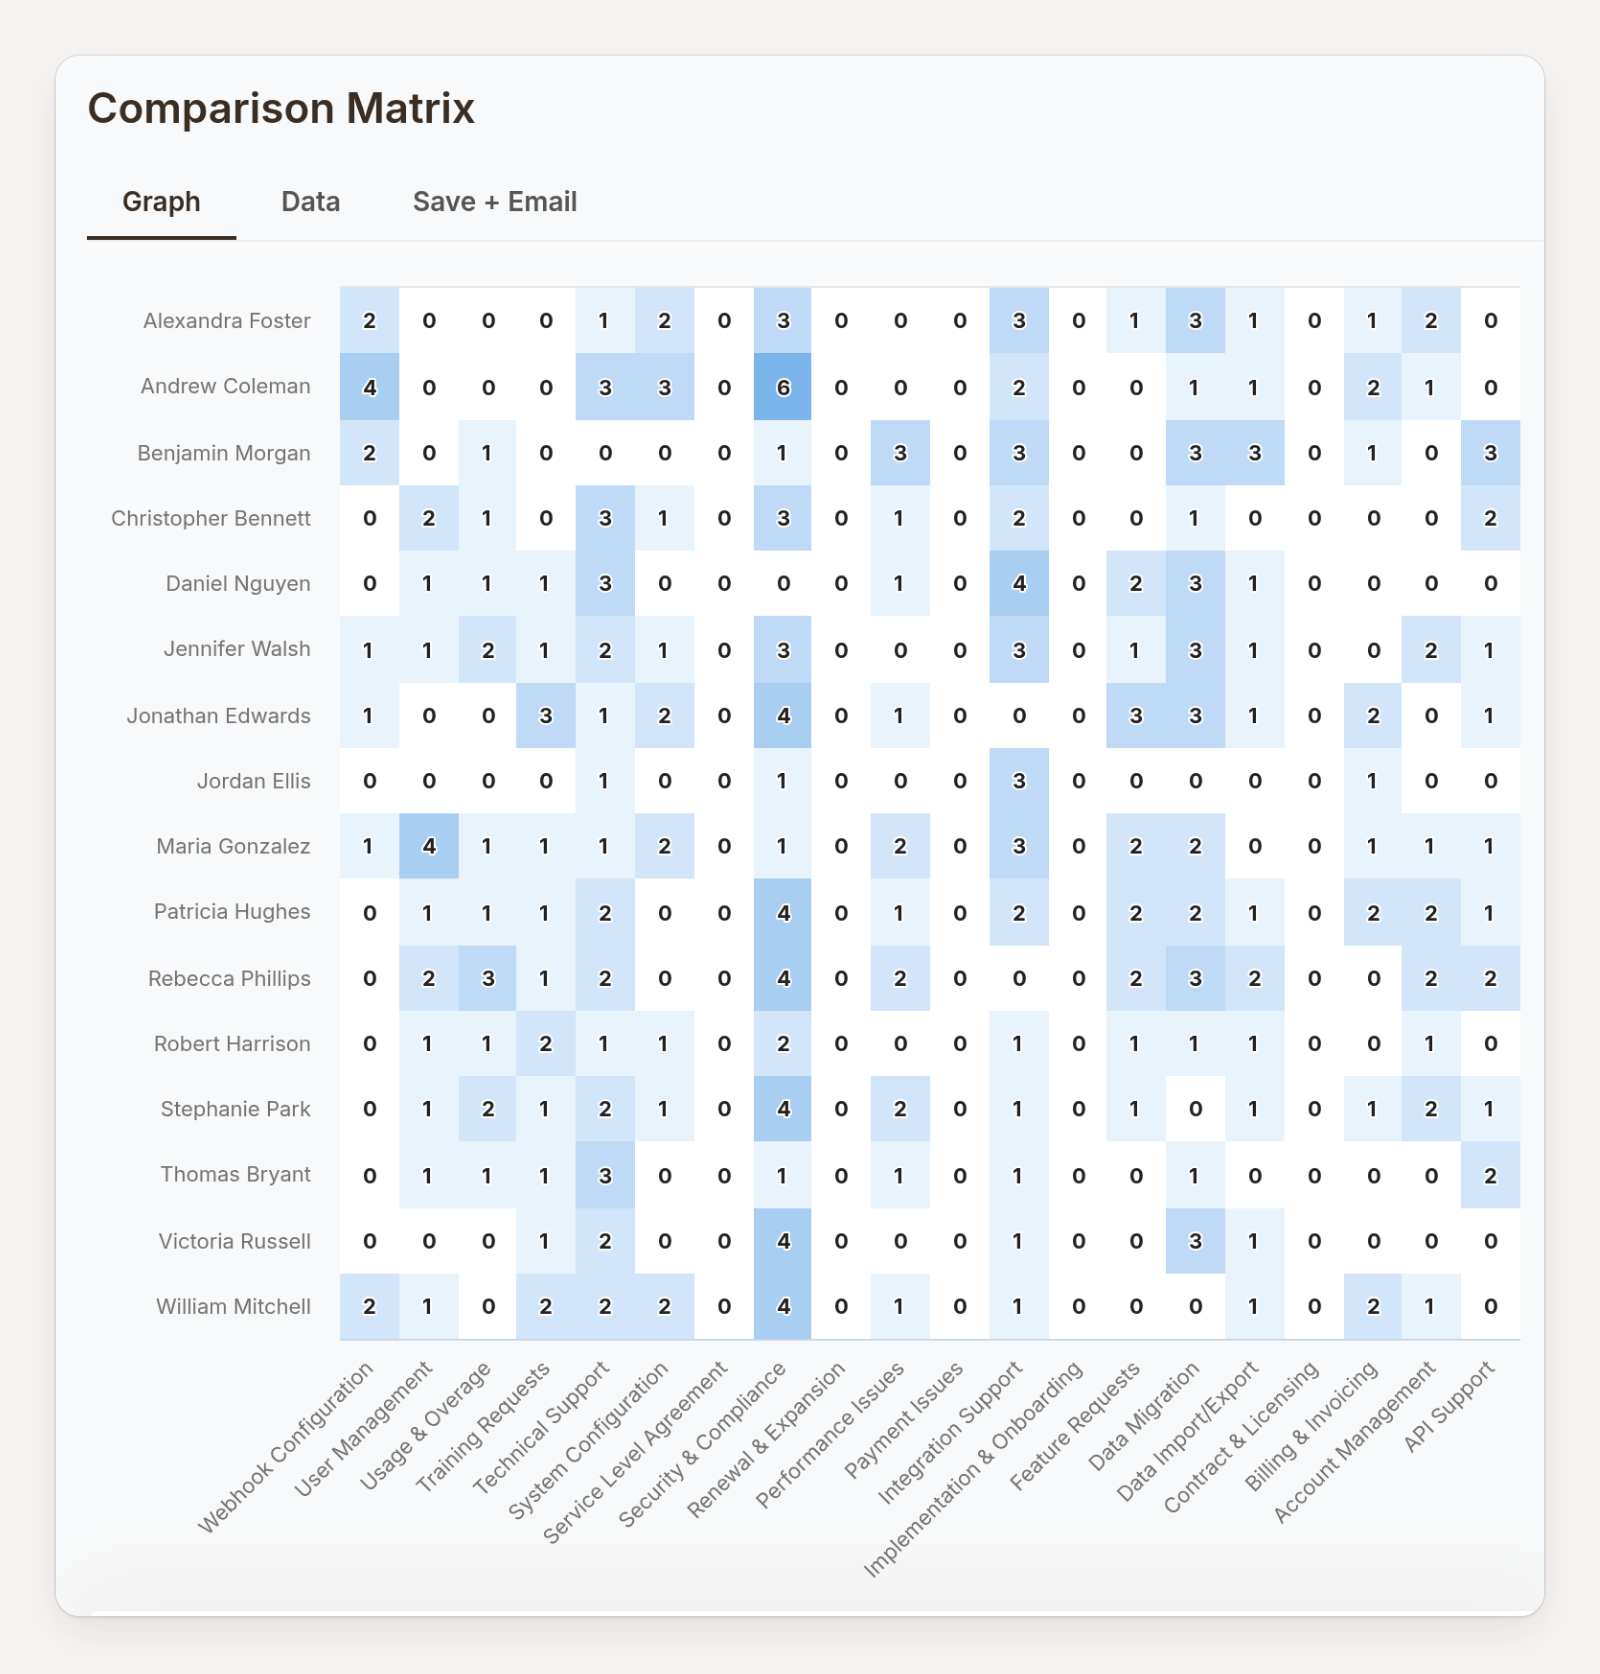
Comparison Matrix puts two fields against each other in a heat map (say, assignee and category), which is a really handy way to spot who's carrying what.
First Response Speed, Resolution Speed, and Productivity Overview cover your questions about how long it takes to get things done, with the option to calculate by business hours.
Time Tracker reports list logged time events and can group them by staff member, which some of our customers use for client billing.
If you're a manager trying to answer "is the team okay?" you want a report. If you're an agent trying to answer "what do I pick up next?" you want a filter.
Counts vs. detail: the most common mix-up
This is the crux of the filters vs. reports dilemma: do I want the count or do I want the details?
Filters can group requests under headings (by category, for example), but they don't show a count beside each group. So if you need "how many open tickets do we have in each category?", a filter will show you all the tickets, neatly sorted, and leave you to do the counting yourself. (Which is a pretty miserable way to spend a Tuesday.)
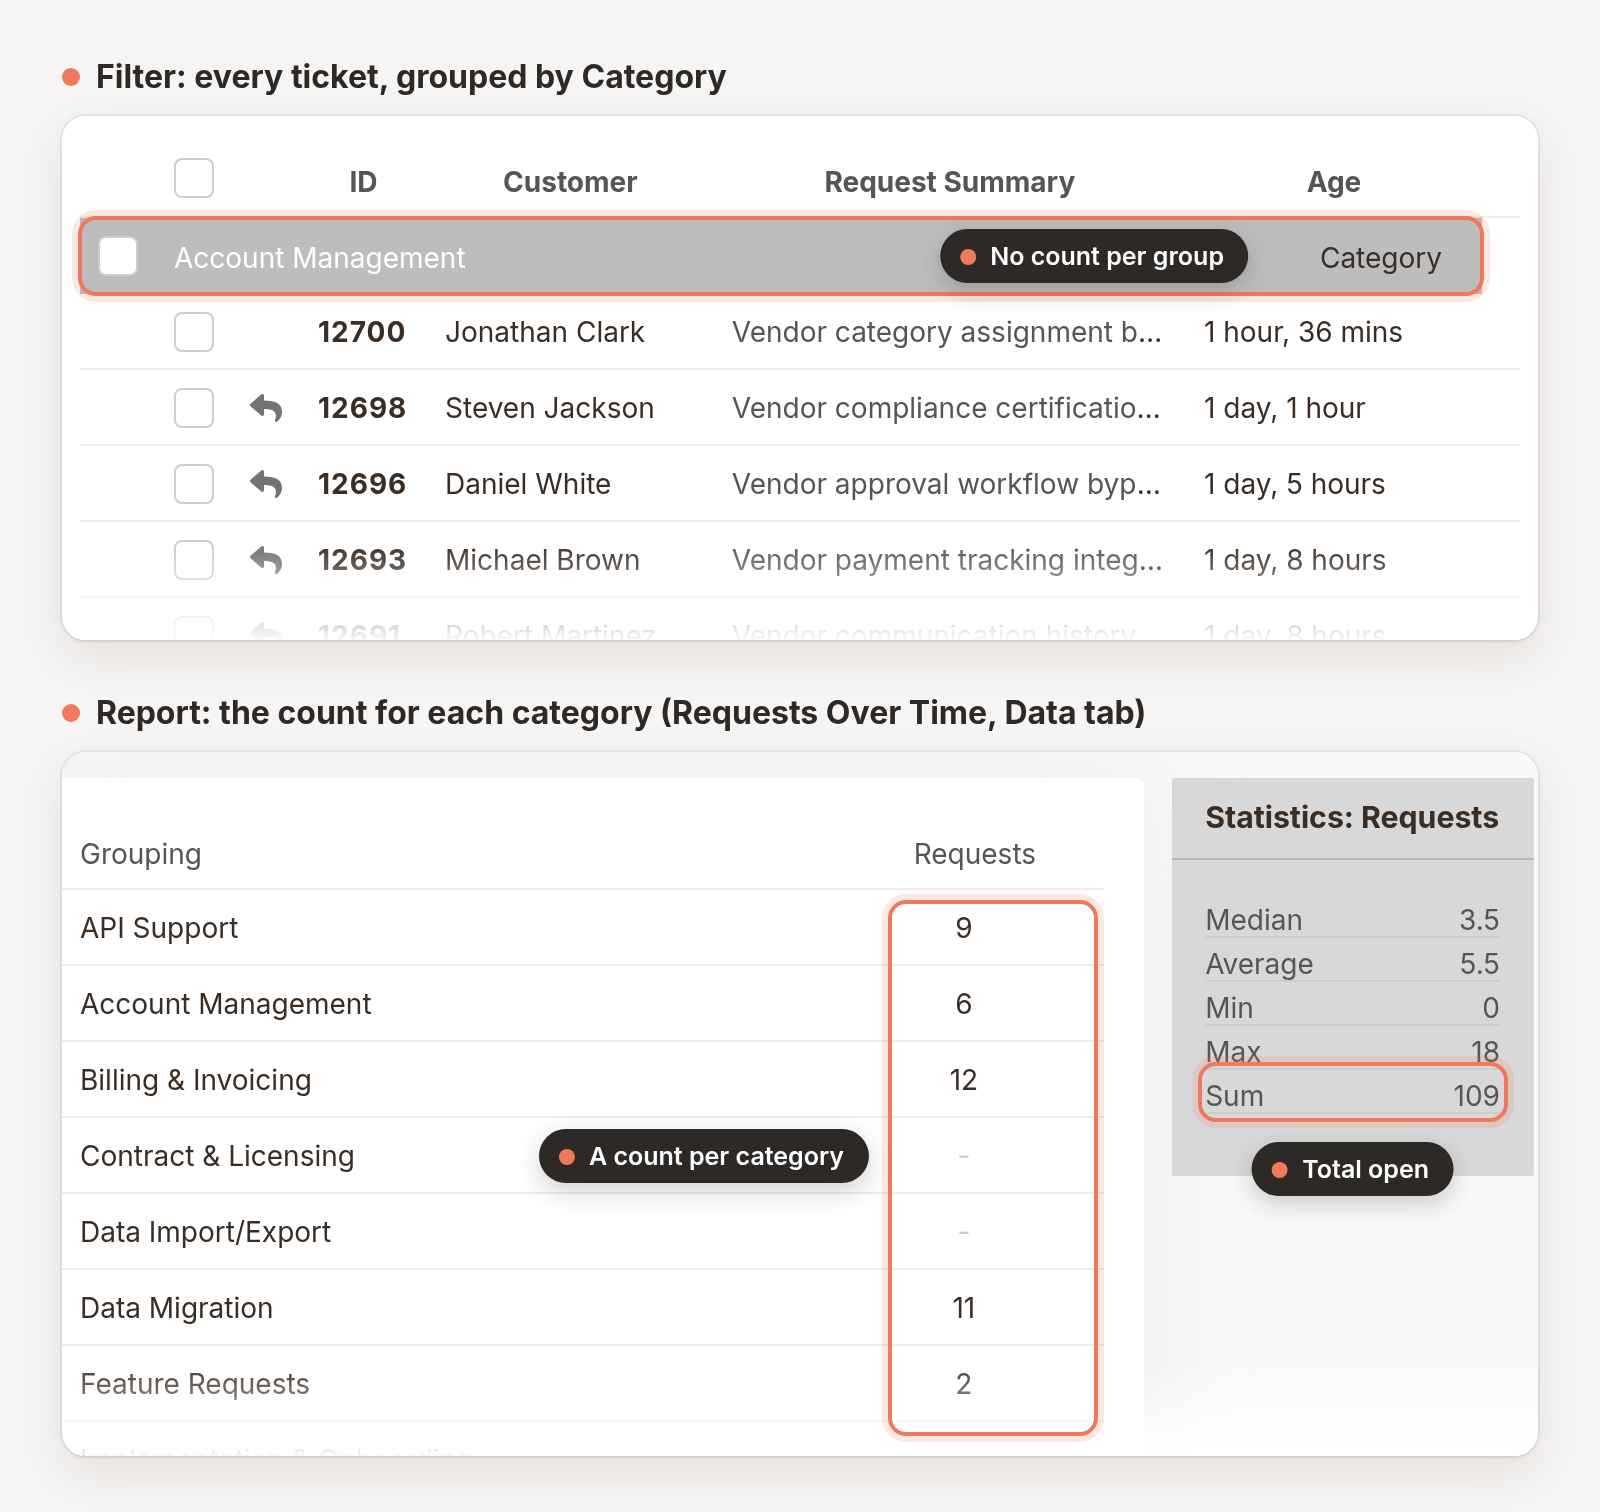
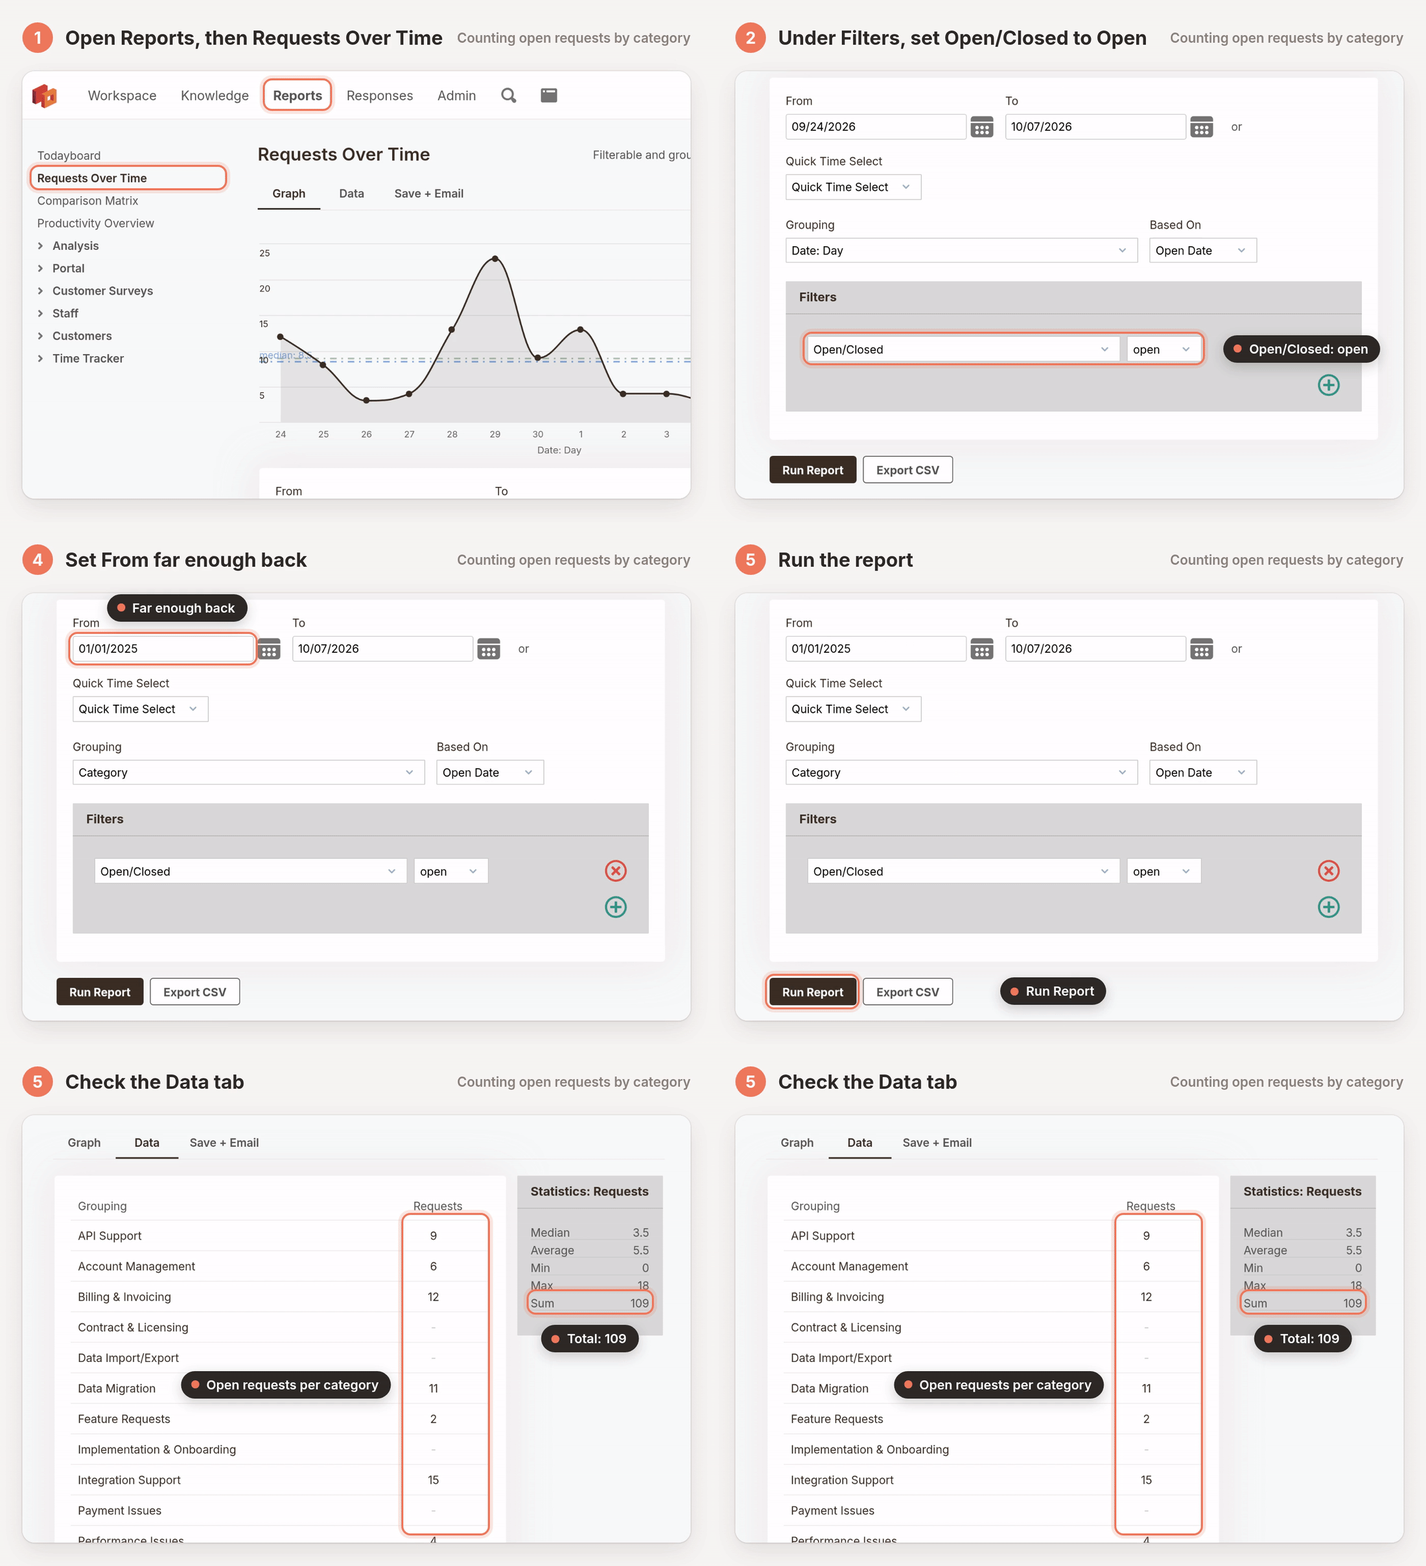
For counts, use the Requests Over Time report instead:
- Open Reports and select Requests Over Time.
- Under Filters, set Open/Closed to Open.
- Set Grouping to Category.
- Set the From date far enough back to include your oldest open ticket. The report counts requests by the date they were opened, and it defaults to the last two weeks.
- Run the report and check the Data tab.
A handy rule of thumb: if the answer you're looking for is a number, start in Reports. If the answer is a list of tickets someone needs to act on, start in Filters.
Let reports come to you
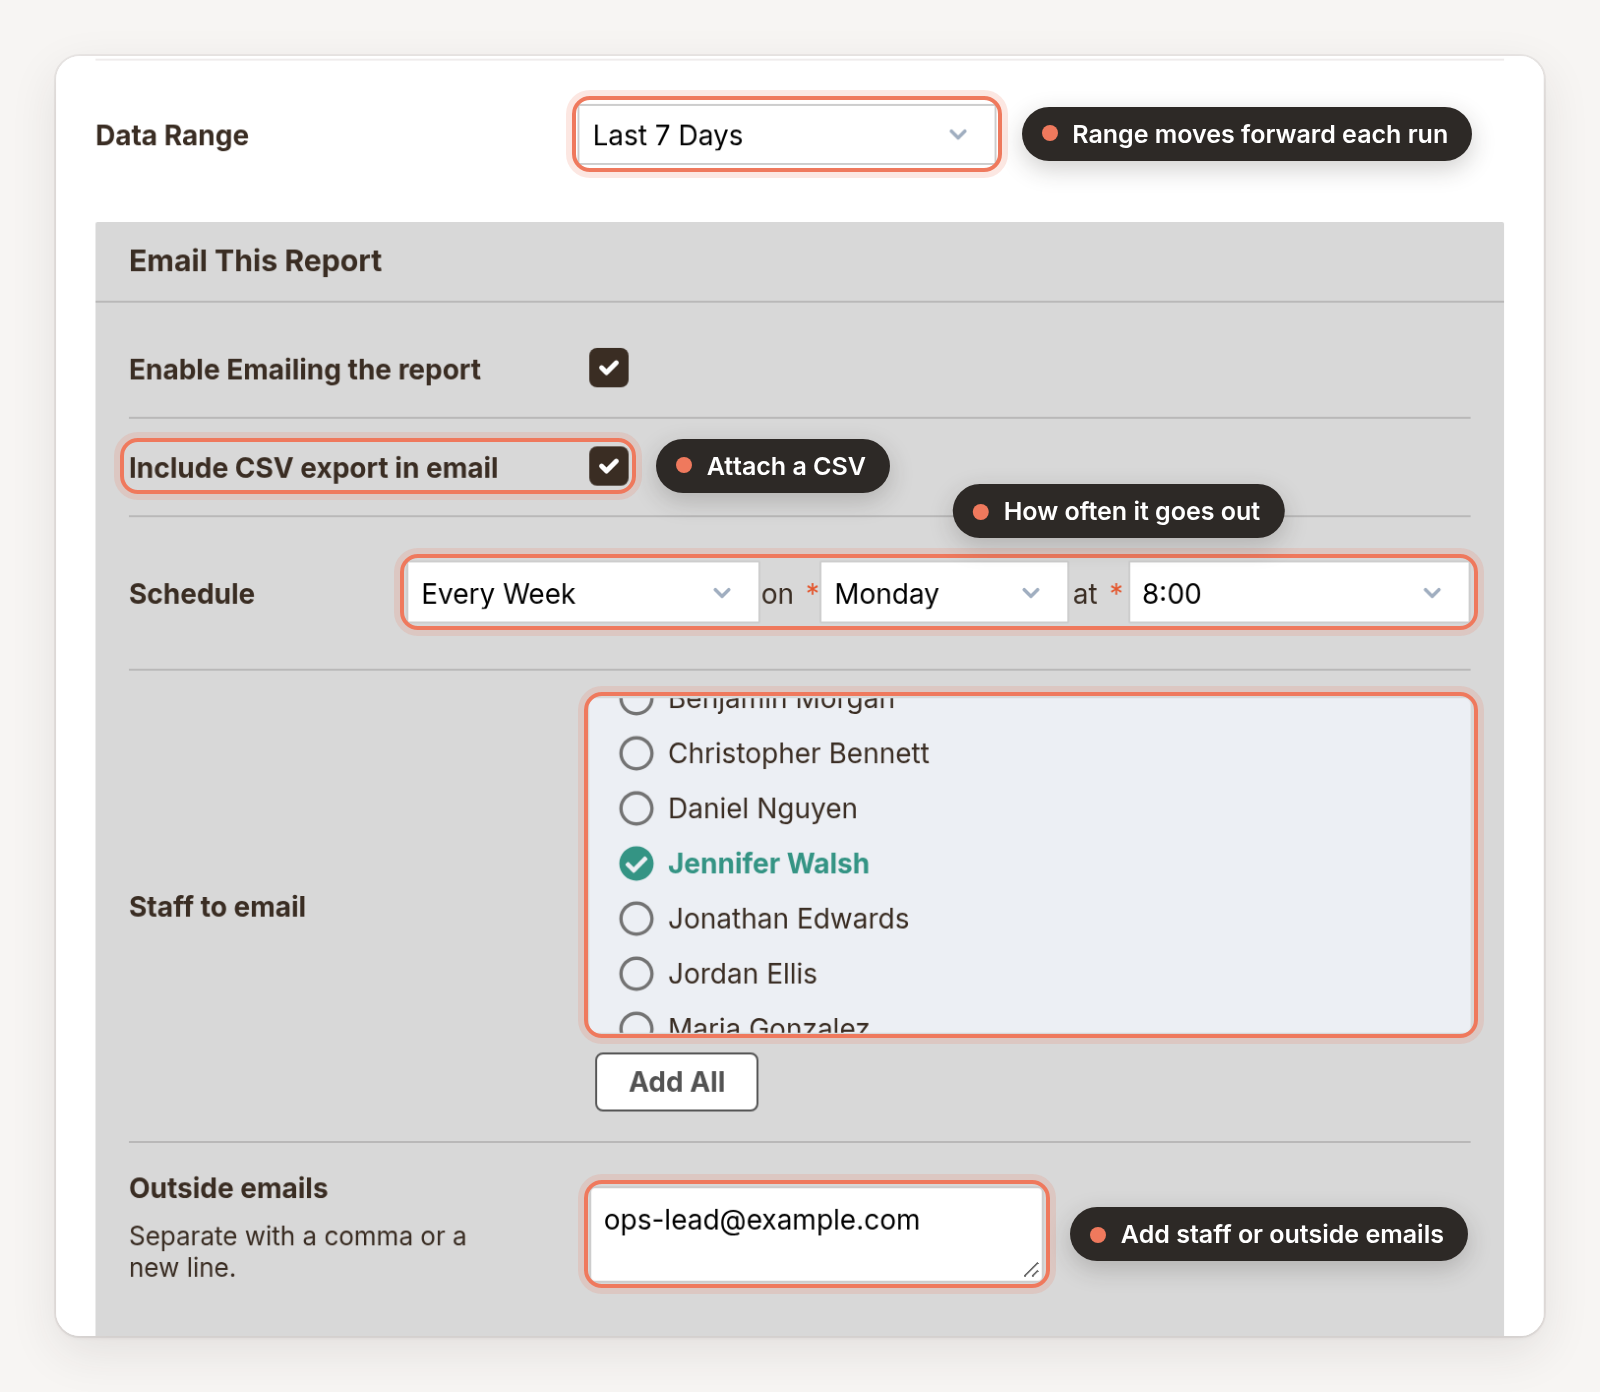
If someone on your team pulls the same report every Monday morning, here's some good news: they can stop doing that.
Any report can be scheduled from the Save + Email tab. Pick how often it goes out, the date range it covers, and who should get it (staff members or outside email addresses). You can also attach a CSV of the data. The date range moves forward automatically each time it runs, so last week's report is always actually last week's.
However, filters don't have a scheduled email option, so if a recurring email is what you're after, build it as a report. You can still export a filter on demand from Options > CSV Export.
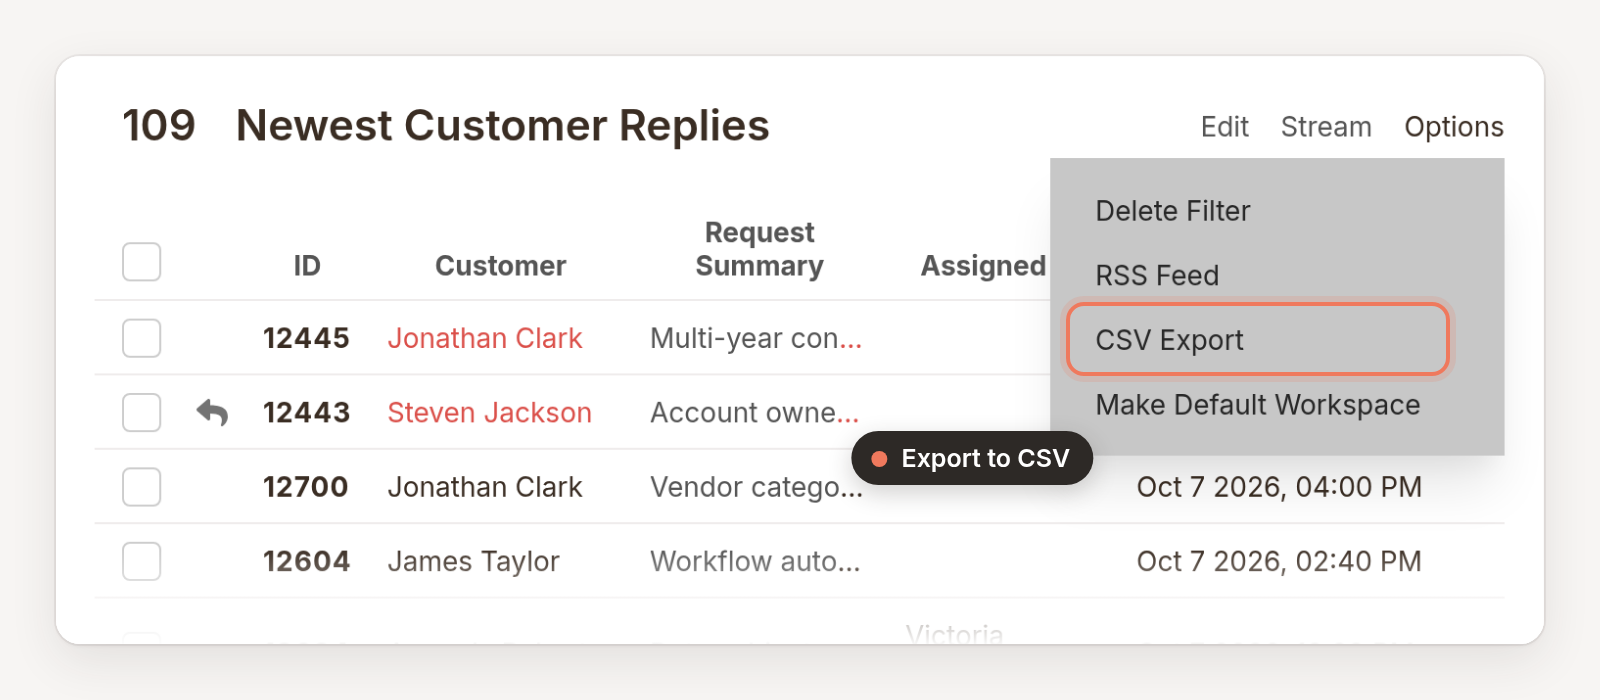
The export uses the filter's display columns and its saved sort order, so set those up in the filter editor the way you want the spreadsheet to look before you export. And if you want the export to show the work that was done, not just the original request, add Latest Public Note or Latest Private Note as a column.
The 12-month filter window problem (and how to fix it)
What do you do when you know a ticket exists, but the filter insists it doesn't?
To keep filters fast, HelpSpot only returns requests from a set number of previous days, controlled by the Filter Within Previous (days) setting in Admin > Settings.
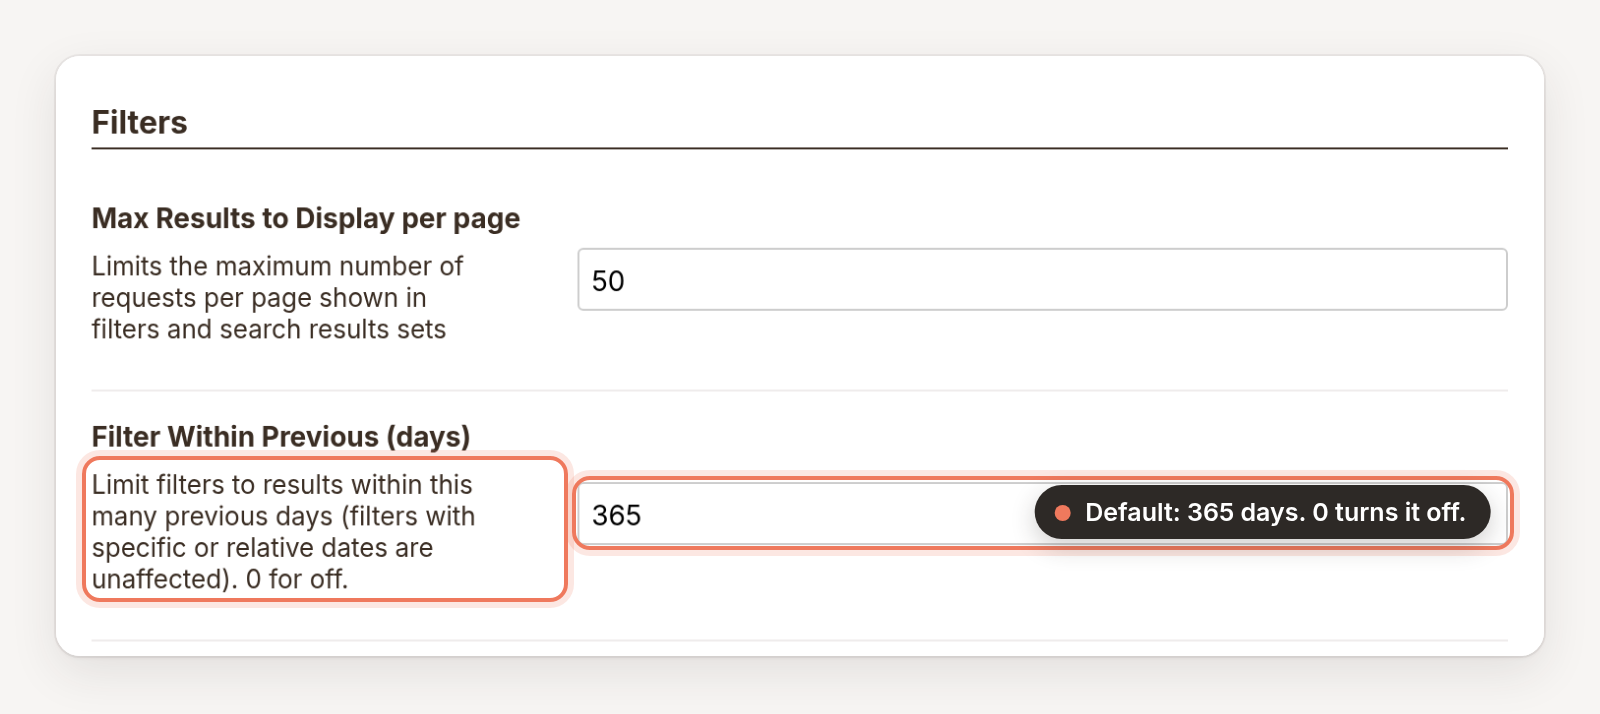
The default is 365 days. Reports don't have that limit, which is why a report can sometimes show more open requests than your filter does.
You have two options:
Fix it for one filter. Add a date condition to the filter and set the range wide enough to include older requests. A filter with its own date condition isn't held to the global limit.
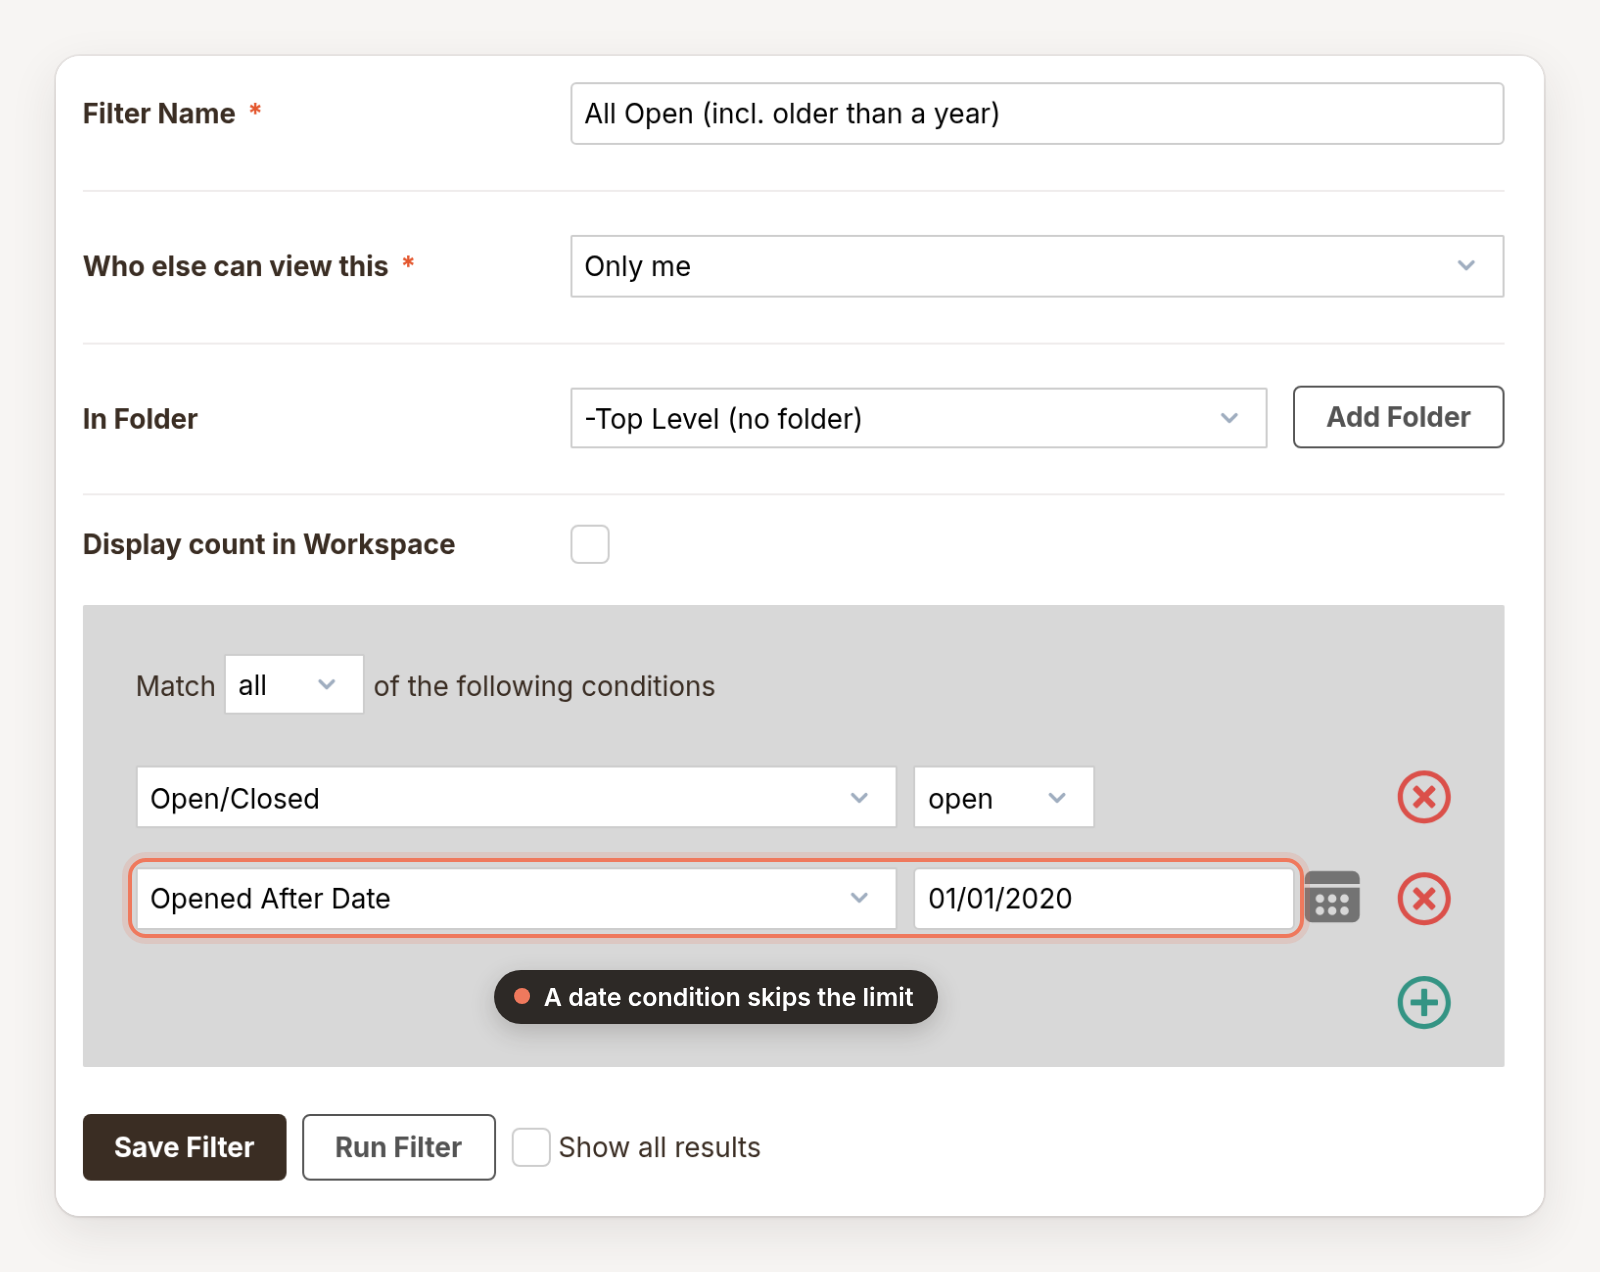
Change it for everyone. Administrators can raise the global limit (or set it to 0 to turn it off). Keep in mind that the setting exists for performance reasons, so we suggest starting with the single-filter fix.
Give your filters a little housekeeping
Before we conclude, here's a little advice for good housekeeping.
Filters are easy to make, which means they're also easy to collect. (If your left navigation has three filters called "Test," no judgment. But maybe today's the day to tidy those up.)
A few things worth knowing:
Who can change what. A filter can be edited or deleted by the person who created it, or by an administrator.
Admins can see and manage everything. Admin > System > Filter Management lists every saved filter in the system, including other people's personal filters. It also flags slow filters: anything averaging more than 0.2 seconds over two weeks shows up under Recent Problem Filters. Each row has its own edit and delete links, so this is the easiest place to clean up after someone leaves the team.
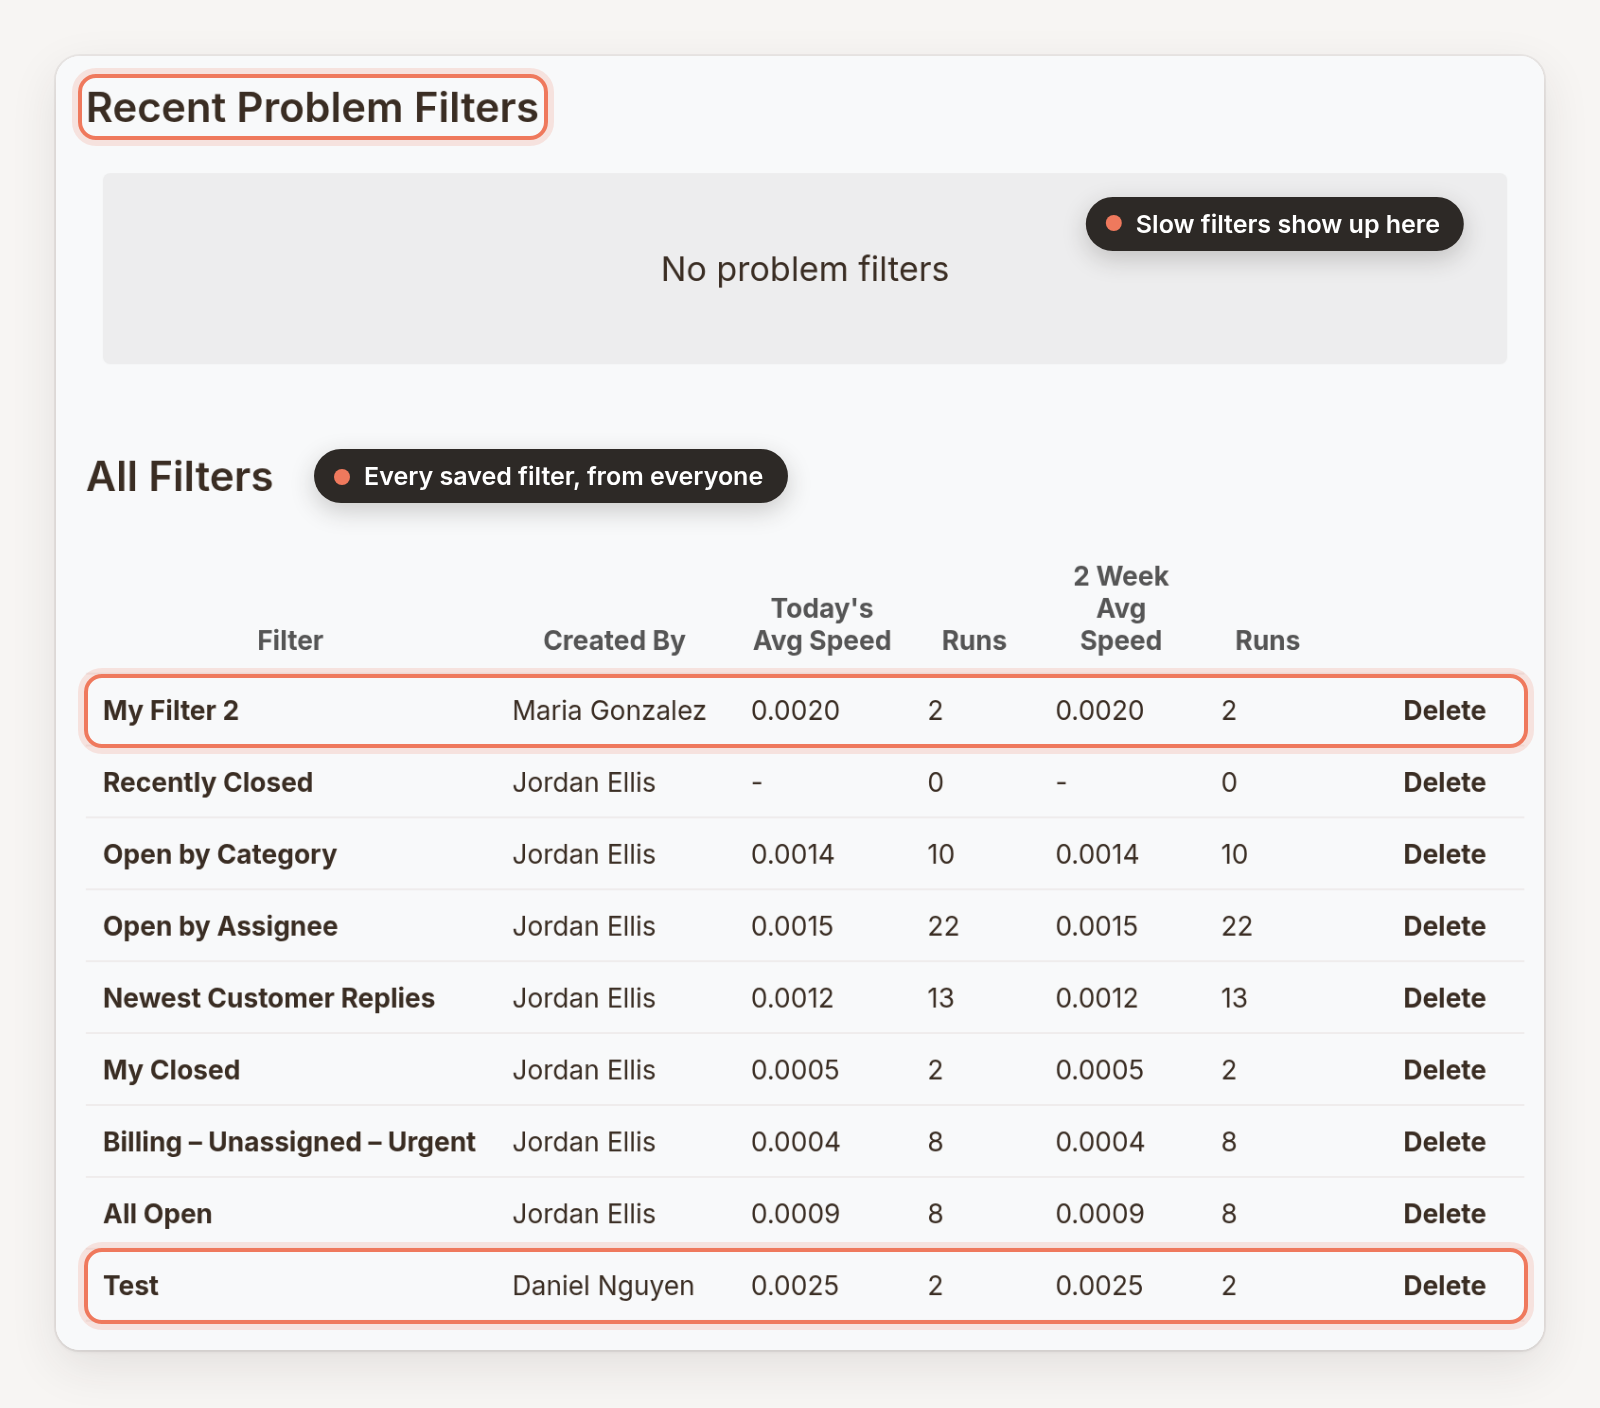
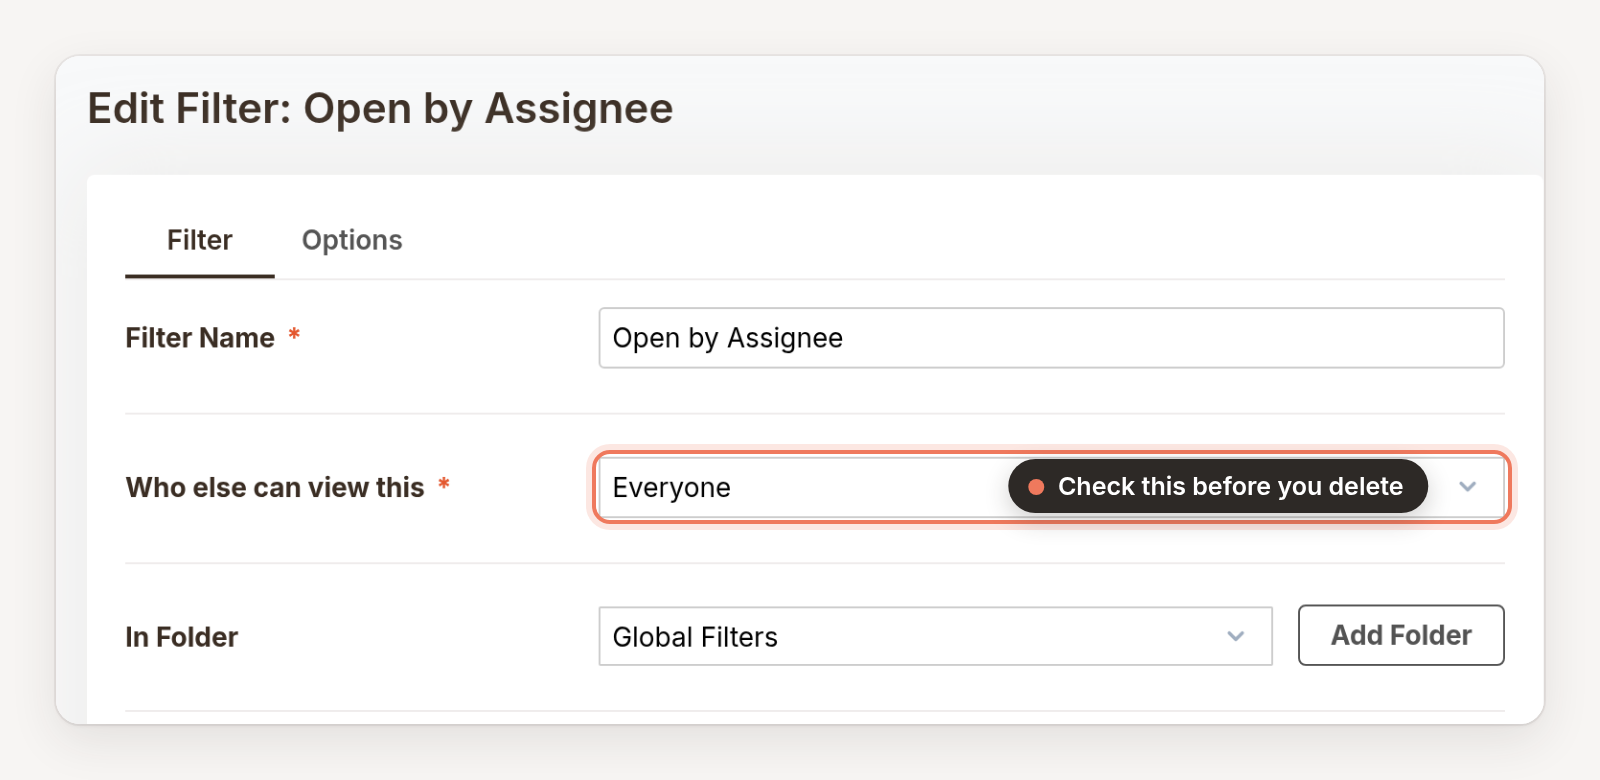
Check before you delete. Deleting a filter is permanent, and a shared filter disappears for everyone it was shared with, without notice. Anyone who used it as their default workspace lands on My Queue instead. Before you delete, open the filter editor and check Who else can view this on the Filter tab.
Name things like future you is reading. "Billing – Unassigned – Urgent" tells you what's inside. "My Filter 2" really doesn't (again, though: guilty here too). A consistent prefix for shared filters ("Global:" or "[Team]:") also helps people tell shared filters from personal ones at a glance.
¿Por qué no los dos?

Filters and reports aren't competing for the same job. The teams that get the most out of HelpSpot use filters to work the queue and reports to learn from it, and they let each one do what it's good at: Filters keep things moving. Reports tell you where they're going.
As a wise internet meme once asked: Why not both?
Want to go deeper? Our Filters documentation walks through every condition and display option, and many have videos to help you understand how to use them.
A filter is a saved view of requests you work from, like a queue. A report aggregates requests into counts, trends, medians, and averages, so you can understand volume and team performance.
No. Scheduled emails are a report feature, set up from a report's Save + Email tab. You can export a filter to CSV on demand from its Options menu.
Filters only return requests from the last 365 days by default, set by Filter Within Previous (days) in Admin > Settings. Add a date condition to the filter to include older requests, or have an administrator raise the global limit.